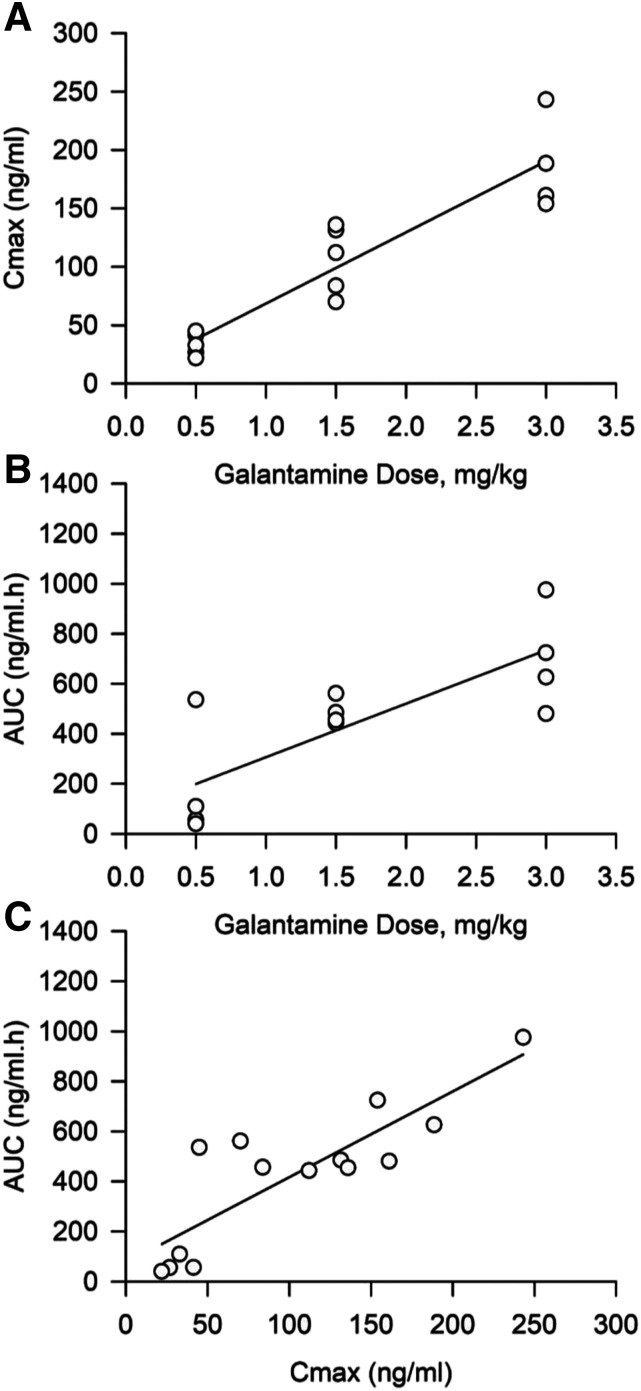
Fig. 2.
Correlation between doses of galantamine and plasma Cmax or AUC and between Cmax and AUC. (A) Cmax of galantamine measured after treatment is linearly correlated with the dose of galantamine delivered to each animal (r2 = 0.70; P < 0.001). (B) AUC of plasma galantamine concentrations versus time is linearly correlated with the dose of galantamine (r2 = 0.62; P < 0.001). (C) Cmax and AUC are also linearly correlated. In all graphs, each data point represents results obtained from the individual subjects in the treatment groups presented in Fig. 1. The solid line represents the linear regression on the data points (r2 = 0.84; P < 0.001).

