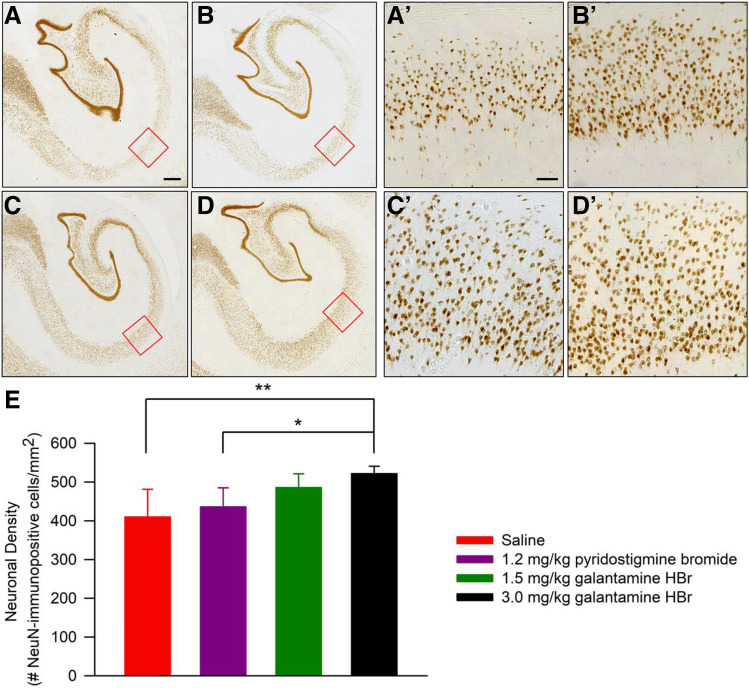
Fig. 7.
NeuN immunoreactivity in the CA1 field of the hippocampus of soman-challenged Cynomolgus that were pretreated with galantamine, pyridostigmine, or saline and posttreated with conventional antidotal therapy. (A–D) Representative photomicrographs of NeuN-immunopositive cells in the CA1 field of the hippocampus of soman-challenged NHPs pretreated orally with saline (A), 1.2 mg/kg pyridostigmine bromide (B), 1.5 mg/kg galantamine HBr (C), or 3.0 mg/kg galantamine HBr (D). The ROIs enclosed within the red squares in (A–D) are magnified in the respective (A’–D’). (E) Quantification of neuronal density. Graph and error bars represent means and S.D. of neuronal density in the CA1 field of the hippocampus of the soman-exposed NHPs subjected to the different treatments. Pairwise comparisons using the Tukey post hoc test: *P < 0.05; **P < 0.01. Scale bar in (A) (500 µm) applies to (A–D) and in (A’) (100 µm), applies to (A’–D’).

