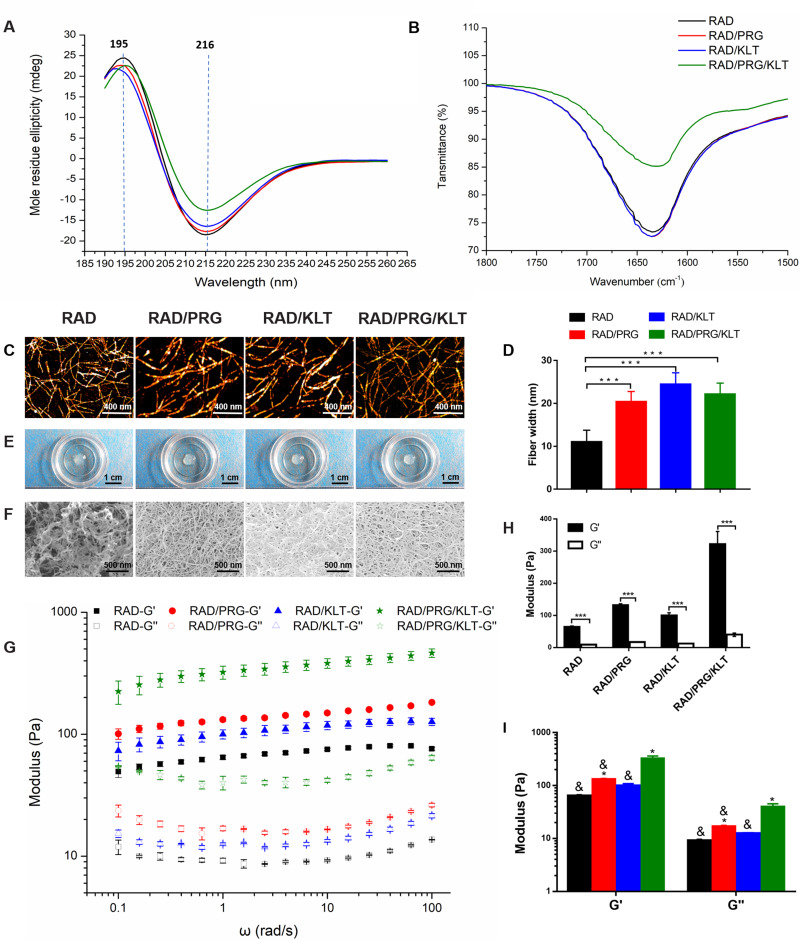
Figure 2.
Microstructural, morphological and rheological studies of the SAPs. (A) CD spectra of the SAPs. (B) FTIR spectra of the SAPs. (C) AFM images of the SAPs. (D) Average fiber width of the SAPs. (E) The SAPs self-assembled to form hydrogels in vitro. (F) SEM images of the SAPs. (G) Rheological analysis of the SAPs. (H) G′ and G″ of the SAPs. (I) Differences of G′ and G″ among the SAPs. Values are represented as means ± SD. The following symbols indicate significant differences (P < 0.05): *Compared to RAD; &Compared to RAD/PRG/KLT. ***P < 0.001.

