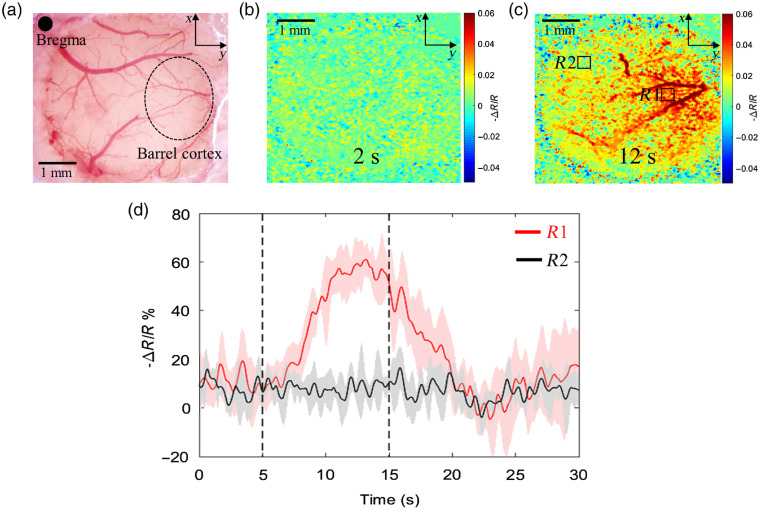
Fig. 2.
IOSI identifies the activation region in the brain cortex upon whisker stimulation. (a) Microscope image of cranial window at somatosensory cortex. (b) Reflectance map of cranial window area at resting (2nd s). (c) Reflectance map of cranial window area at stimulation (12th s). R1 indicates the activated region and R2 indicates the control region. (d) Temporal profile of reflectance signal change in response to whisker stimulation at activated (red curve) and control (black curve) regions. is a change in reflectance signal, is a baseline reflectance signal. Dashed lines indicate the start and the end of stimulation time.

