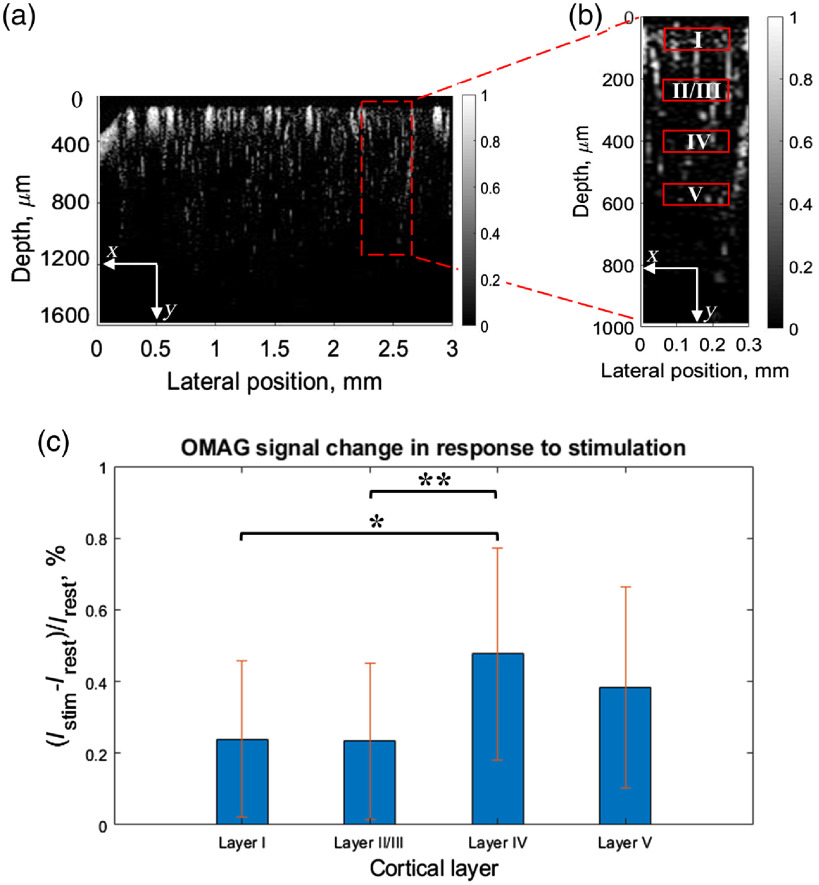
Fig. 4.
OMAG provides an ability to detect the variation of hemodynamic response over cortical depth upon whisker stimulation. (a) OMAG cross-sectional blood flow image with activated region indicated (red rectangle). (b) OMAG cross-sectional blood flow image of activated region indicated in A with layers’ location indicated. (c) Difference in OMAG signal intensity between rest and functional activation states over cortical depth averaged over six animals. Error bars represent the standard deviation. *, **.

