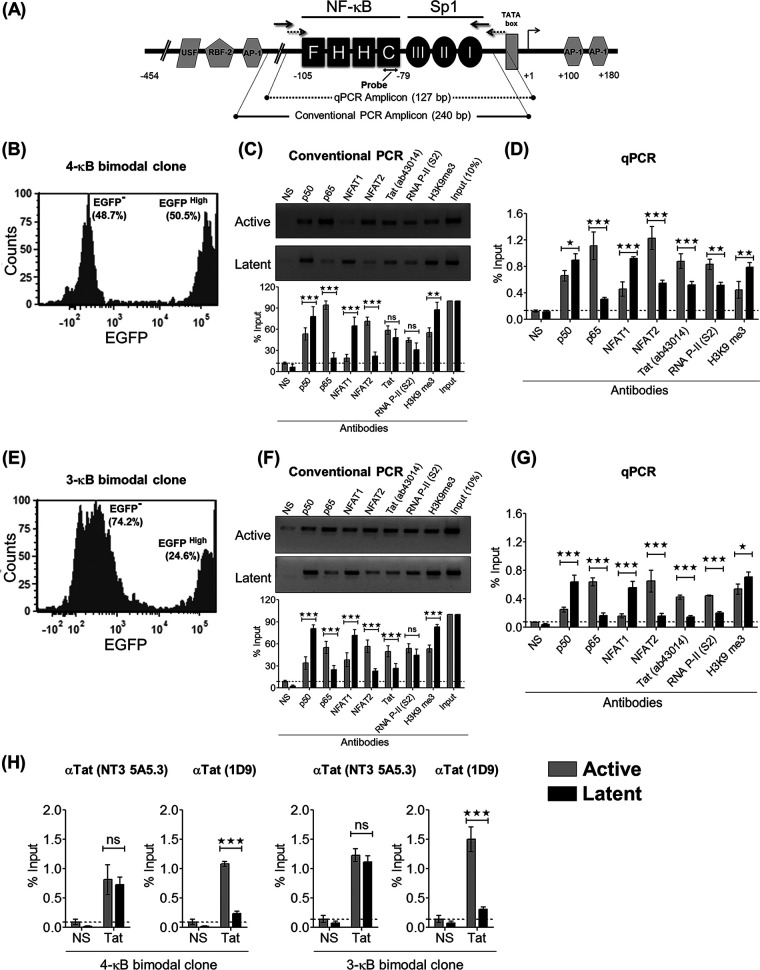
FIG 10.
Active and latent LTRs recruit host factors differentially. (A) Schematic representation of the LTR sequence and the positions of the primer pairs used for conventional PCR (240 bp) (solid black) and qPCR (127 bp) (dotted black) for ChIP analysis. (B and E) Presort percentages of EGFP− and EGFPHigh cells corresponding to the 4-κB (B) and the 3-κB (E) bimodal clones. (C and F) Data from a conventional PCR-based ChIP assay of the active (EGFPHigh) and latent (EGFP−) promoters for several host factors and the Tat protein for the 4-κB (C) and 3-κB (F) clones, respectively. The cell lysate from 2 million cells (active or latent) and 2 μg of the respective antibody were used for the individual IP reactions. A rabbit polyclonal anti-Tat antibody (catalog number ab43014; Abcam) was used for the Tat IP. One-tenth of the immunoprecipitated chromatin was used as the input control. NS refers to a matched IgG isotype control antibody. Conventional PCR was repeated three times for each IP reaction. Representative gel images and data from the corresponding densitometry analyses are presented. Data for each band are normalized to the input. The mean values from quadruplicates ± SD are plotted. A two-tailed, unpaired t test was used for statistical analyses (*, P < 0.05; **, P < 0.01; ***, P < 0.001; ns, nonsignificant). (D and G) A qPCR-based ChIP assay was performed independently using identical experimental conditions and the 4-κB (D) or the 3-κB (G) clone. The data for each IP were calculated using the percent input method. NS refers to a matched IgG isotype control antibody. The mean values from qPCR triplicates ± SD are plotted. A two-tailed, unpaired t test was used for statistical analyses (*, P < 0.05; **, P < 0.01; ***, P < 0.001; ns, nonsignificant). (H) Two additional qPCR-based ChIP assays using two different mouse monoclonal anti-Tat antibodies (1D9 and NT3 5A5.3) were performed using the active and latent fractions of the two bimodal clones. The mean values from qPCR triplicates ± SD are plotted. A two-tailed, unpaired t test was used for statistical analyses (*, P < 0.05; **, P < 0.01; ***, P < 0.001; ns, nonsignificant).

