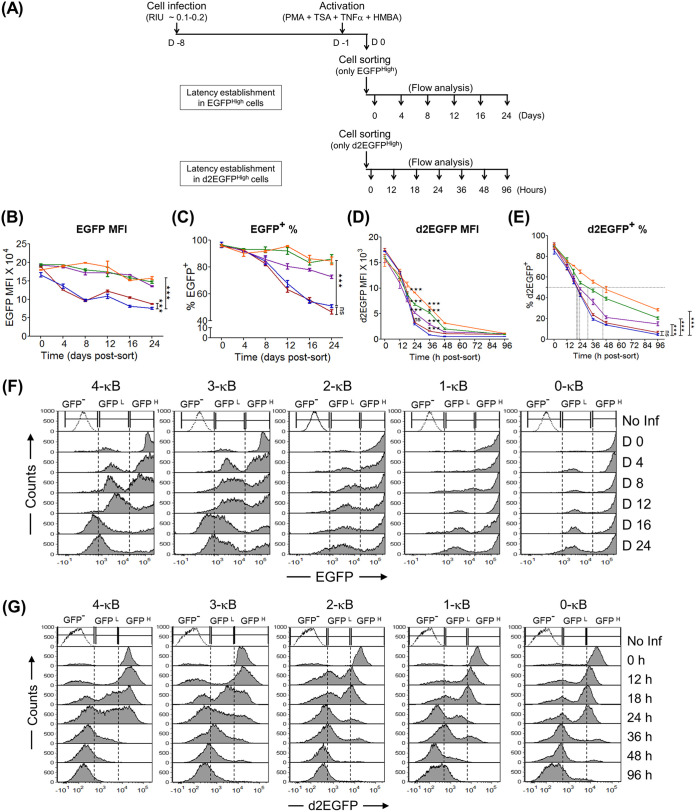
FIG 4.
The binary latency trajectory of the GFPHigh population delineates the viral promoter into strong (3- and 4-κB) and weak (2-, 1-, and 0-κB) LTRs. (A) Experimental schemes to study the kinetics of latency establishment in EGFPHigh and d2EGFPHigh cells. (B to E) Comparative kinetic profiles of EGFP MFIs, percentages of EGFP+ cells, d2EGFP MFIs, and percentages of d2EGFP+ cells, respectively. Mean values from experimental triplicates ± SD are shown and are representative of results from two independent experiments. Two-way ANOVA with Bonferroni posttest correction was used for the statistical evaluation (***, P < 0.001; ns, nonsignificant). (F) Stacked histogram profiles of EGFPHigh cells during latency establishment. The sorted EGFPHigh cells (GFPH) (MFI, >104 RFU), comprising a homogeneous population of Tat-mediated transactivated cells, transitioned to the EGFP− phenotype (GFP−) through an EGFPLow cluster (GFPL) (MFI, ∼102 to 104 RFU), representing cells with a basal level of transcription without an intermediate phenotype. No Inf, Jurkat cells not infected. (G) Stacked histogram profiles of d2EGFPHigh cells during latency establishment identify regions of d2EGFP− (GFP−) (MFI, <103 RFU), d2EGFPLow (GFPL) (MFI, ∼103 to 104 RFU), and d2EGFPHigh (GFPH) (MFI, >104 RFU) phenotypes. Of note, given the shorter half-life of d2EGFP, the stability of the d2EGFPLow phenotype was extremely transient; hence, the present system lacked a distinct d2EGFPLow cluster at any time point, unlike in the EGFP system (Fig. 3C).

