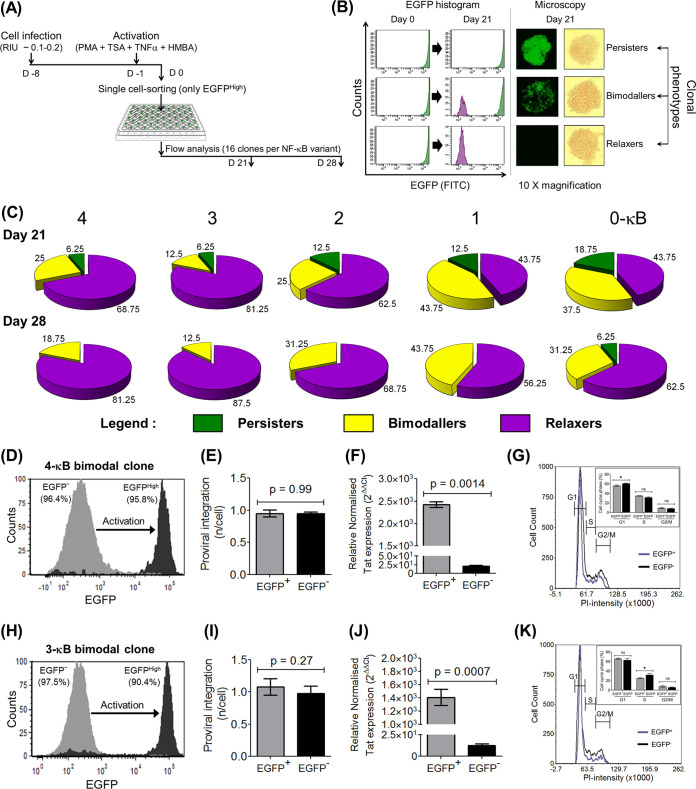
FIG 5.
Manifestation of three distinct latency phenotypes of single EGFPHigh cells. (A) The experimental layout of latency establishment in single-cell clones is essentially similar to that of nonclonal population kinetics as shown in Fig. 4A. EGFPHigh cells (MFI, >104 RFU) were single-cell sorted and expanded for 3 to 4 weeks, and the pattern of EGFP expression was assessed on days 21 and 28 postsorting by flow cytometry and fluorescence microscopy. The EGFP expression levels of 16 randomly selected clones corresponding to each viral variant were measured. (B) Based on the fluorescence profile, three distinct categories of clones, persisters (EGFPHigh) (MFI, >104 RFU), relaxers (EGFP−) (MFI, <103), and bimodallers (binary population of persisters and relaxers), were identified. FITC, fluorescein isothiocyanate. (C) Relative proportions of the above-described three phenotypes among the LTR variants as a function of time, as indicated at days 21 and 28 postsorting. (D and H) Two bimodal cell lines, 3c and 8c, representing the 4-κB and 3-κB LTRs, respectively, demonstrate bimodal gene expression. The sorted EGFP− cells from the 4-κB and 3-κB clones generated 95.8% (D) and 90.4% (H) EGFPHigh cells, respectively, following activation with the global activation cocktail, with a negligible proportion of cells displaying the intermediate phenotype. (E and I) TaqMan qPCR targeting a region of the LTR, performed as described in the legend of Fig. 3J, confirms comparable integration frequencies (∼1.0 provirus per cell) between the EGFP− and EGFPHigh fractions in both the 4-κB (E) and the 3-κB (I) clones. (F and J) Quantitative real-time PCR of Tat transcripts demonstrates significantly higher levels of Tat transcripts in the EGFPHigh fraction than in the EGFP− fraction for both clones. Mean values from three independent experiments ± SEM are plotted. A two-tailed, unpaired t test was used for the statistical evaluation. (G and K) DNA cell cycle analysis was performed on the EGFP− and EGFPHigh subfractions of the 4-κB (G) and the 3-κB (K) clones according to the standard PI staining protocol. Overlay histograms for the two subfractions showing the G1, S, and G2/M phases are presented. The proportions of cells in the G1, S, and G2/M stages were calculated for both subfractions and are depicted in the insets. Mean values from triplicates, representative of results from two independent reactions, ± SD are plotted. A two-tailed, unpaired t test was used for the statistical evaluation.

