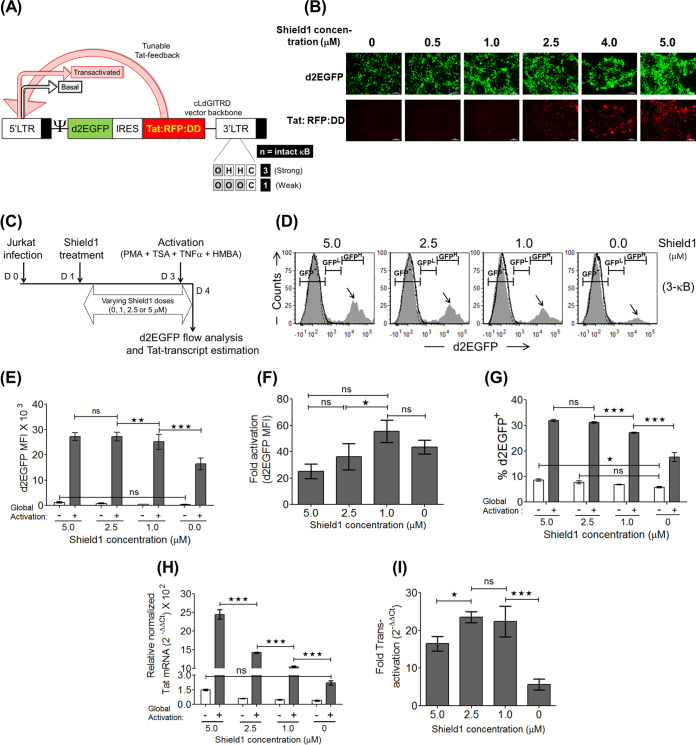
FIG 6.
In the tunable Tat feedback (TTF) model, the stronger the LTR-Tat feedback, the higher the viral gene expression level. (A) Schematic of the subgenomic HIV-1 vector backbone cLdGITRD representing the TTF model. The 3- and 1-κB LTRs, representing a strong and a weak promoter, respectively, are used in the present study. The small molecule Shield1 stabilizes the Tat:RFP:DD cassette in a dose-dependent fashion, making it available for subsequent transactivation events at the LTR. (B) Validation of Shield1 dose-dependent stabilization of the Tat:RFP:DD cassette in HEK293T cells. One milligram of the cLdGITRD-3-κB vector was transfected into 0.6 million HEK293T cells in separate wells in the presence of various concentrations of Shield1, as indicated, and the images were captured at 48 h posttransfection. The experiment was repeated twice, with comparable results. (C) Experimental layout to confirm Shield1 dose-dependent gene expression and Tat transactivation in Jurkat cells. Approximately 0.3 million Jurkat cells were infected with the LdGITRD-3-κB strain (20 ng/ml p24 equivalent), and after 24 h, the infected cells were split into four fractions, each treated with a different concentration of Shield1, as indicated. After 48 h of Shield1 treatment, half of the cells from each fraction were activated for 24 h, followed by the quantitation of d2EGFP and Tat mRNA expression levels for both the induced and uninduced fractions. (D) Representative stacked histograms indicate a Shield1 dose-dependent Tat-transactivated population (black arrows) at a fixed LTR strength (fixed number of NF-κB motifs). The peak height of the d2EGFPHigh population (MFI, >104 RFU) was proportionally reduced with the Shield1 dose; the TTF model thus confirmed that the d2EGFPHigh cluster represents the Tat-transactivated population. (E to G) Shield1 concentration-dependent d2EGFP MFI (E), fold d2EGFP enhancement (F), and percent d2EGFP+ (G) plots. Values from experimental triplicates ± SD, representing the results of two independent experiments, are plotted. Two-way ANOVA with Bonferroni posttest correction was used for the statistical evaluation (**, P < 0.01; ***, P < 0.001; ns, nonsignificant). (H and I) Relative Tat transcript levels (H) and fold Tat-mediated transactivation (I) were evaluated as described in the legends of Fig. 2G and H, respectively. The mean values from three independent experiments ± SEM are plotted. Two-way ANOVA with Bonferroni posttest correction was used for the statistical evaluation (*, P < 0.05; ***, P < 0.001; ns, nonsignificant).

