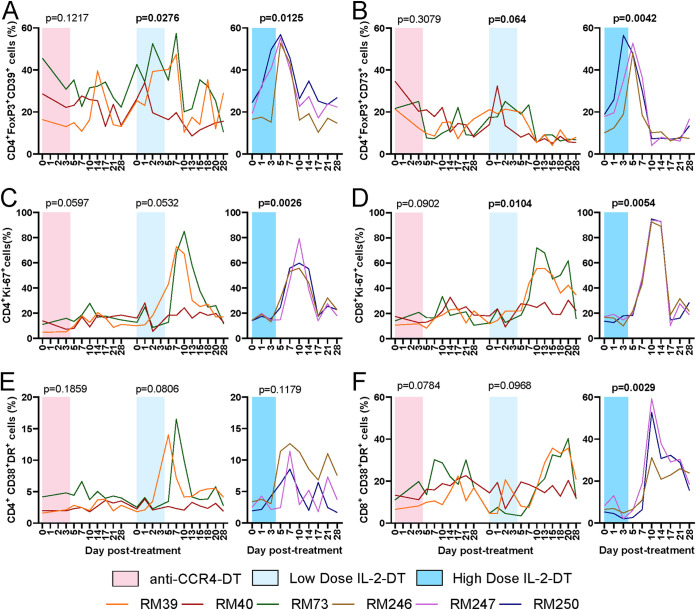
FIG 3.
(A) Dynamics of the CD39+ Tregs (FoxP3high CD4+ T cells) after the administration of anti-CCR4-DT, low-dose IL-2-DT, and high-dose IL-2-DT. (B) Dynamics of the CD73+ Tregs after the administration of anti-CCR4-DT, low-dose IL-2-DT, and high-dose IL-2-DT. The y axes illustrate the frequency of CD39+ or CD73+ Tregs (%). (C and D) Dynamics of T cell immune activation, as illustrated by the levels of Ki-67 expression by the CD4+ (C) and CD8+ (D) T cells after administration of anti-CCR4-DT, low-dose IL-2-DT, and high-dose IL-2-DT. (E and F) Dynamics of T cell immune activation, as illustrated by the levels of CD38 and HLA-DR coexpression by the CD4+ (E) and CD8+ (F) T cells after administration of anti-CCR4-DT, low-dose IL-2-DT, and high-dose IL-2-DT. The y axes illustrate the frequency (%) of activated CD4+ or CD8+ T cells; the x axes illustrate the number of days post-DT administration. Different treatments are color-coded. A Friedman test was performed individually for each treatment, and P < 0.05 (boldface) values were considered significant.

