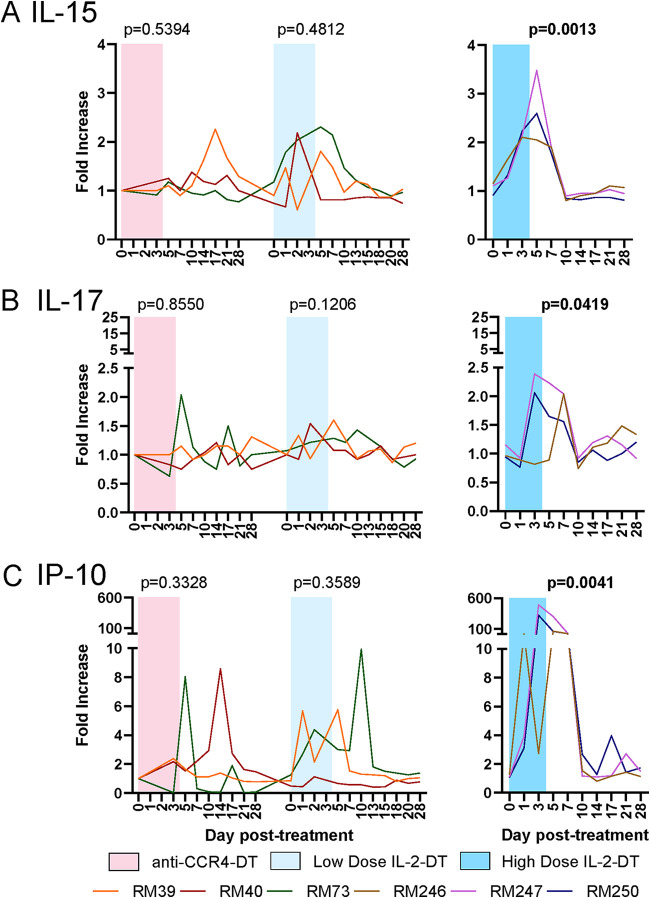
FIG 5.
Dynamics of inflammatory cytokines following the administration of the Treg-depleting agents. (A to C) Fold changes in serum IL-15 (A), serum IL-17 (B), and serum IP-10 (C) in treatment with anti-CCR4-DT, low-dose IL-2-DT, and high-dose IL-2-DT. Different treatments are color-coded. The y axes illustrate the fold increase in the levels of cytokines; the x axes illustrate the number of days post-DT administration. A Friedman test was performed individually for each treatment, and P < 0.05 (bold) values were considered significant.

