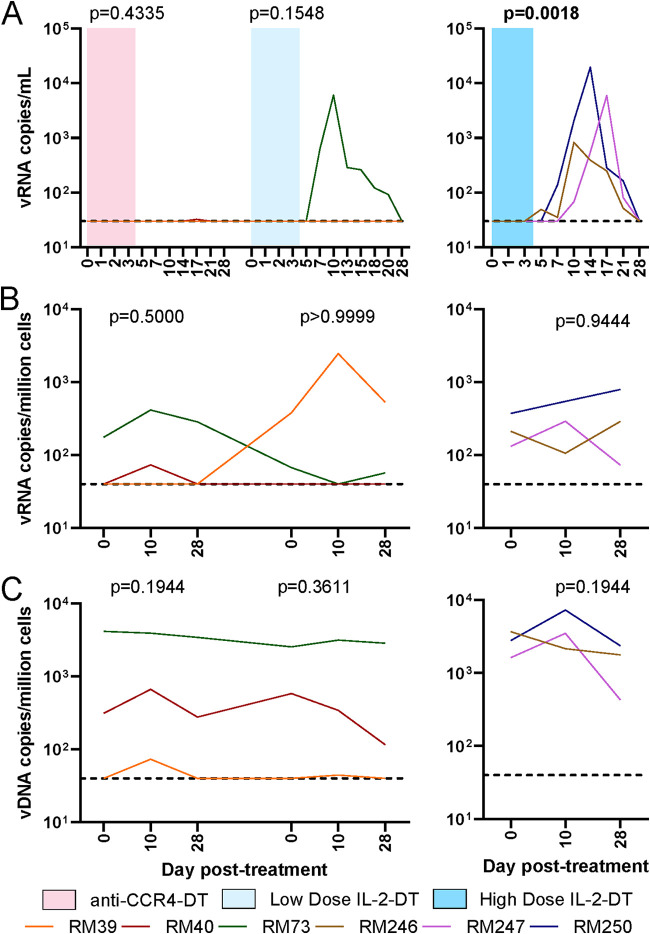
FIG 6.
Impact of the different Treg depletion strategies on the virus levels in SIVsab-infected RMs. (A) Plasma viral load (VL) dynamics after administration of anti-CCR4-DT, low-dose IL-2-DT, and high-dose IL-2-DT. (B) PBMC-associated viral RNA (vRNA) copies/million cells after the administration of anti-CCR4-DT, low-dose IL-2-DT, and high-dose IL-2-DT. (C) PBMC-associated vDNA copies/million cells after the administration of anti-CCR4-DT, low-dose IL-2-DT, and high-dose IL-2-DT. Different treatments are color-coded. The y axes illustrate the levels of vRNA or vDNA; the x axes illustrate the number of days post-DT administration. The limit of detection for the plasma VL assay was 30 copies/ml. A Friedman test was performed individually for each treatment, and P < 0.05 (bold) values were considered significant.

