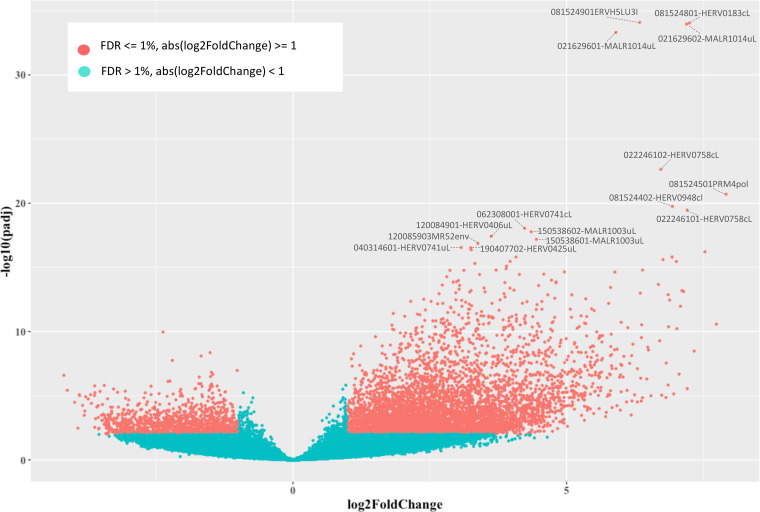
FIG 5.
Differential HERV/MaLR expression analysis. Volcano plot of the differentially expressed hervgbd4 fragments. Each point represents hervgbd4 fragments, which spread according to the log2-fold change (x axis) and the log10-adjusted P values (y axis). Red points indicate significantly modulated hervgbd4 fragments. For 15 hervgbd4 fragments with the lowest adjusted P values, the names are indicated.

