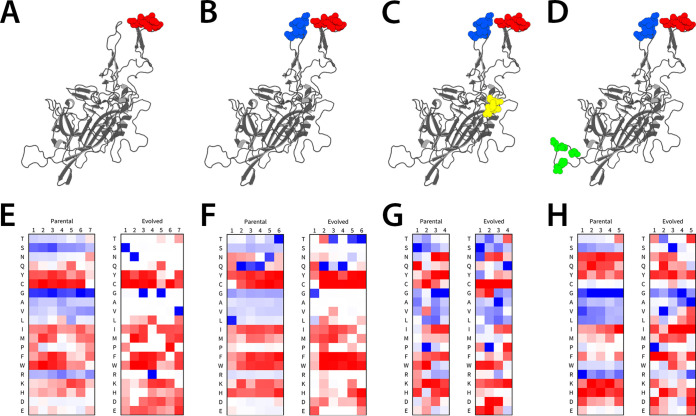
FIG 4.
Analysis of amino acid prevalence at each position in the parental and evolved libraries. (A to D) AAV8 monomers showing regions mutated in iterative evolution. (E to H) Heatmap of amino acid frequency at each position of the parental and evolved libraries. The most and least common residues in each position are blue and red, respectively, while the 50th percentile is white. Since the region IV lead mutant was one amino acid shorter here than in the parent, this is represented in panel E as no amino acid being the most common in the 6th position of the evolved library.

