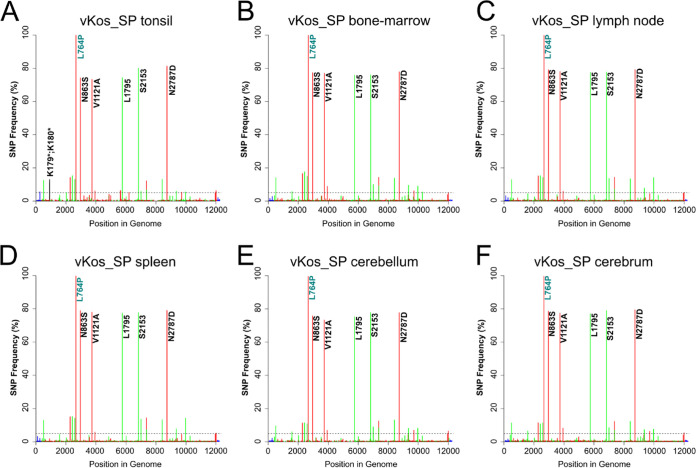
FIG 8.
SNP frequency plots of tissue samples from vKos_SP-inoculated pig 1 (infection study II). (A) vKos_SP tonsil. (B) vKos_SP bone marrow. (C) vKos_SP lymph node. (D) vKos_SP spleen. (E) vKos_SP cerebellum. (F) vKos_SP cerebrum. Note the reference sequence in each case is the consensus BAC clone Kos_SL sequence. Synonymous changes are indicated in green, nonsynonymous changes in red, stop codons gained in black, and changes in the UTRs in blue. Dotted line indicates 5% frequency.

