FIG 4.
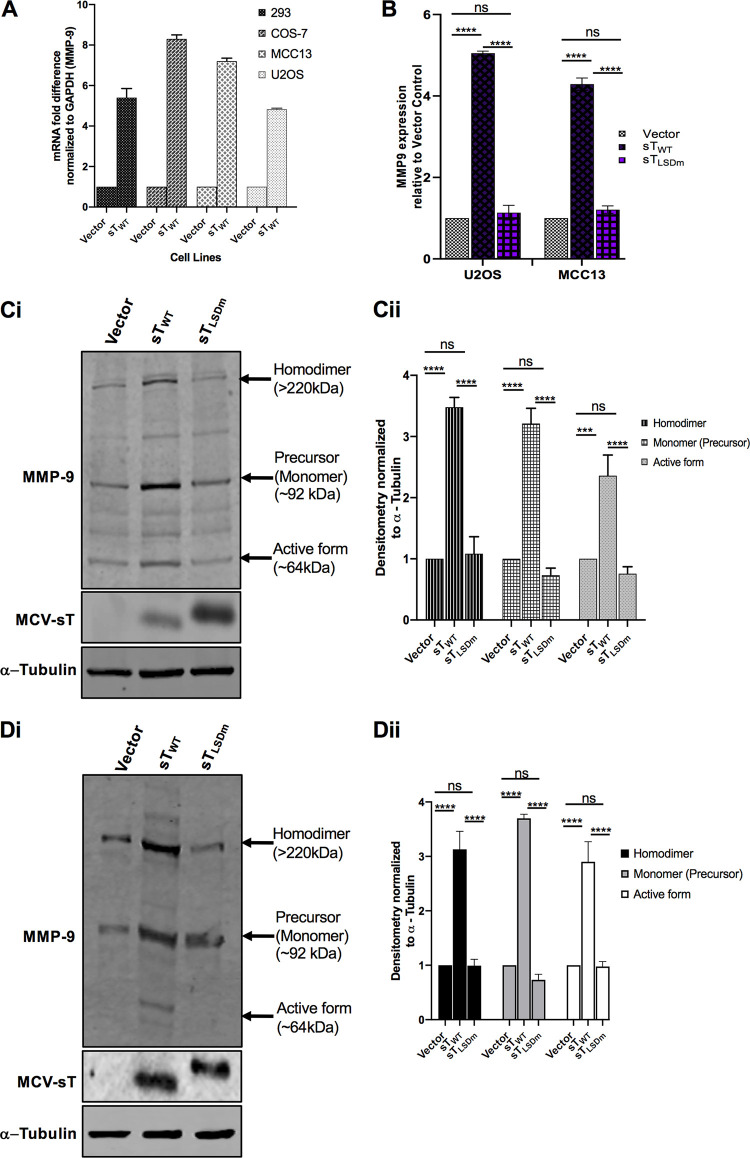
MCV sT activates MMP-9. (A) MCV sT expression results in upregulation of MMP-9 mRNA levels. Various cell lines (HEK293, COS-7, MCC13, and U2OS) were transfected with either empty vector or MCV sTWT-expressing plasmids to measure MMP-9 mRNA levels. After 48 h, total RNA was isolated and analyzed by RT-qPCR. (B) MCV sT upregulates MMP-9 transcription through the LSD. U2OS and MCC13 cells transfected with empty vector control, MCV sTWT-, or MCV sTLSDm-expressing plasmids. Transcript levels of MMP-9 were analyzed using the comparative ΔΔCT method. (n = 3). Differences between means (P value) were analyzed using a t test with GraphPad Prism software. (C) MCV sT upregulates MMP-9 protein expression through the LSD. (i) U2OS cells were transfected with empty vector, MCV sTWT, or sTLSDm expression plasmids. After 48 h, immunoblot analysis was performed to analyze expression of MMP-9, sT, and α-tubulin. (ii) Densitometric analysis of immunoblots was carried out using the Image studio software (LI-COR Biosciences) and is shown as a fold change relative to the loading control, α-tubulin. Data analyzed using three biological replicates per experiment (n = 3). (D) MCV sT reproducibly activates MMP-9 expression in MCC13. (i) Quantitative immunoblot analysis was performed to analyze expression of MMP-9, sT, and α-tubulin. (ii) Densitometric analysis of immunoblots (n = 3).

