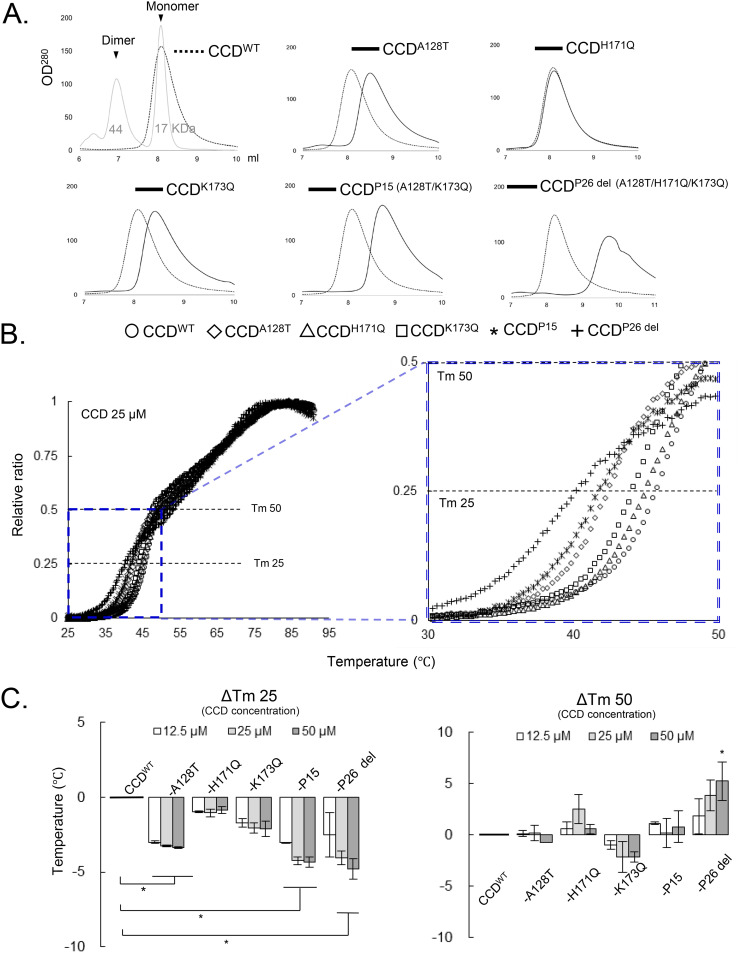
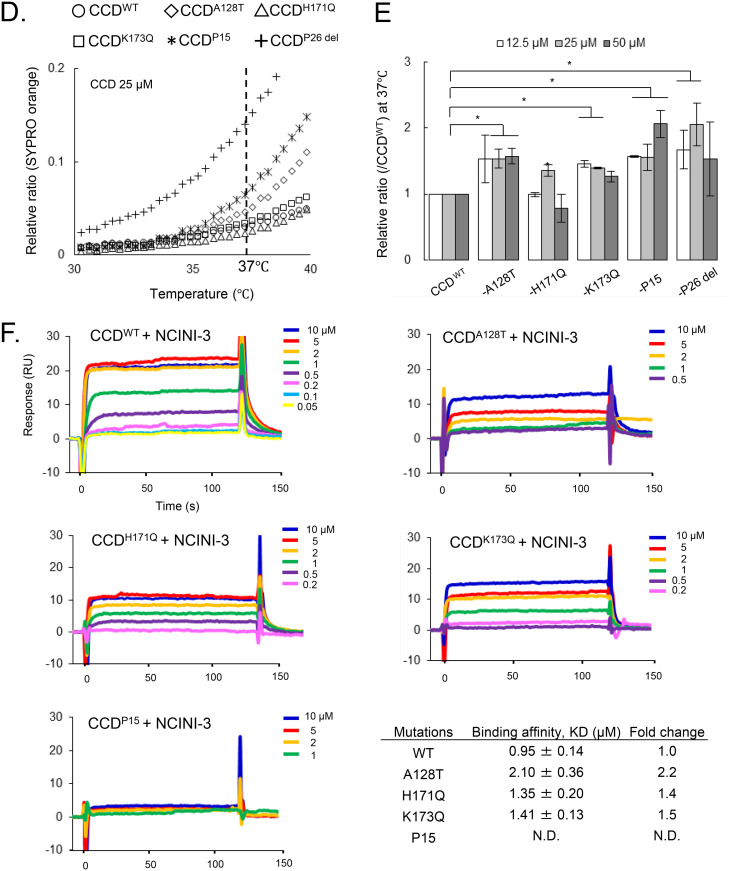
FIG 4.
Effect of NCINI-3 resistance mutations on the CCD. (A) SEC analysis of CCD proteins carrying NCINI-3 resistance mutations together with F185K. The elution profile of CCDWT is shown with two molecular weight standards (44 and 17 kDa) and estimating the size positions of CCD dimers and monomers. Those of CCDA128T, CCDH171Q, CCDK173Q, CCDP15, and CCDP26 del at a 50 μM concentration was are shown compared with CCDWT. (B) DSF analysis of CCD proteins carrying NCINI-3 resistance mutations. (Left) The fluorescence of CCDWT, CCDA128T, CCDH171Q, CCDK173Q, CCDP15, and CCDP26 del was detected and is plotted as a relative ratio from 25°C to 95°C. (Right) Expanded plots from 30°C to 50°C. (C) ΔTm 25 or 50 values indicating the Tm 25 or 50 differences between CCDWT and CCD proteins carrying the mutations at 12.5, 25, and 50 μM CCD concentrations. The assays were performed in triplicate, and error bars indicate SD from two independent experiments. The statistical significance of ΔTm 25 or 50 was examined using two-tailed Student’s t test (*, P < 0.05). (D) Relative ratios of SYPRO orange fluorescence of CCDWT and CCD proteins carrying the mutations from 30°C to 40°C at a 25 μM concentration. (E) Proportions of surface hydrophobic sites of CCD proteins at 37°C. The relative ratios were obtained from SYPRO orange binding to the surface hydrophobic sites of CCD proteins carrying the mutations compared to CCDWT at 12.5, 25, and 50 μM concentrations. The assays were performed in triplicate, and error bars indicate SD from two independent experiments. Statistical significance was examined using Student’s t test (*, P < 0.05). (F) SPR analysis of NCINI-3 interactions with CCDWT, CCDA128T, CCDH171Q, CCDK173Q, and CCDP15. Data shown represent results derived from two independent experiments. Shown are KD values of NCINI-3 for CCDWT and CCD proteins carrying the mutations, and fold changes indicate KD ratios of CCD proteins carrying the mutations to CCDWT. Error bars indicate SD from two independent experiments. N.D., not determined.


