FIG 6.
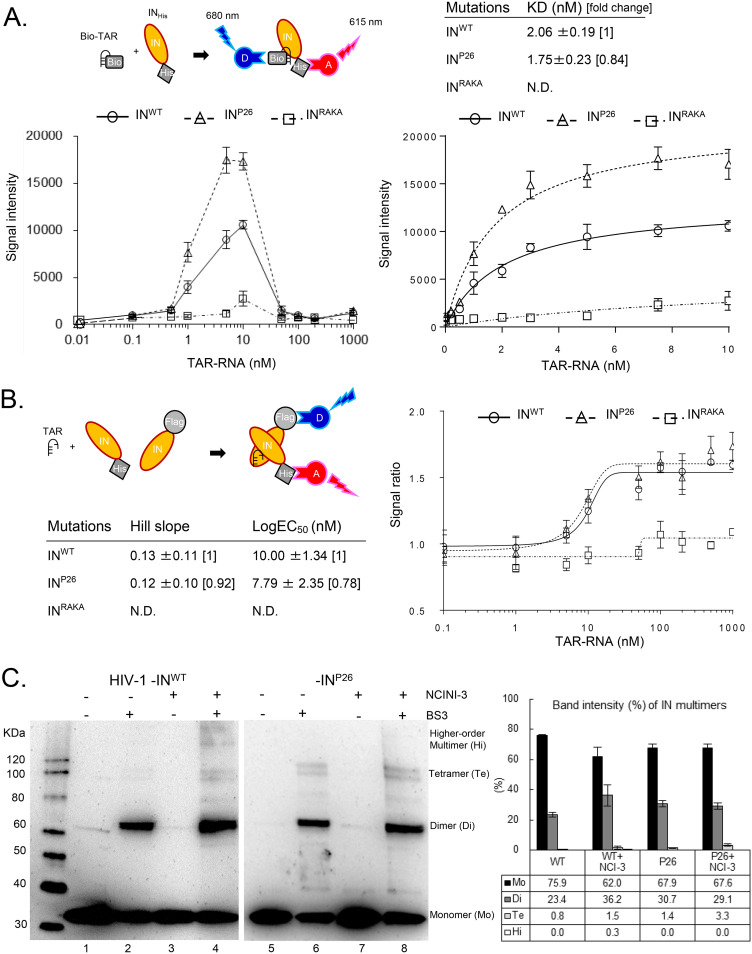
IN undermultimerization is stabilized by HIV-1 RNA and restored in viral particles. (A) Alpha 1 for direct binding between biotinylated TAR RNA (Bio-TAR) and INHis. The schematic illustration at the top left indicates that streptavidin-coated donor (D) and anti-His acceptor (A) beads bind to the Bio-TAR–INHis complex. The Alpha signal intensity between INHis (INWT, INP26, and INRAKA at 10 nM) and Bio-TAR (from 0 to 1,000 nM) is shown at the bottom left. The intensities of INWT, INP26, and INRAKA from 0 to 10 nM Bio-TAR are fitted to saturated curves at the bottom right. The curves and mean KD values ± SD were determined from representative fitting data from three independent experiments. (B) Alpha 2 for indirect IN multimerization between F-IN and INHis. The schematic illustration indicates that anti-Flag-coated donor and anti-His coated acceptor beads bind to a dimer of F-IN and INHis. Alpha signal ratios between F-IN and INHis proteins (INWT, INP26, and INRAKA, respectively) by the addition of 0.1 to 1,000 nM concentrations of TAR RNA were fitted to sigmoid curves. Mean Hill slopes and log EC50s ± SD were calculated by representative sigmoid curves from three independent experiments. (C) IN multimerization of HIV-1NL4-3 INWT and INP26 viral particles generated in the presence or absence of 20 μM NCINI-3. The HIV-1 INWT and INP26 clones were purified by ultracentrifugation. Highly concentrated HIV-1 INWT and INP26 were cross-linked with (lanes 2, 4, 6, and 8) or without (lanes 1, 3, 5, and 7) BS3 and visualized by SDS-PAGE with anti-HIV-1 IN antibody. Monomers, dimers, tetramers, and high-order multimers of INWT and INP26 are shown as multimer ratios (percent) determined by measuring each band intensity using ImageJ. The ratios represent mean values ± SD from two independent experiments.

