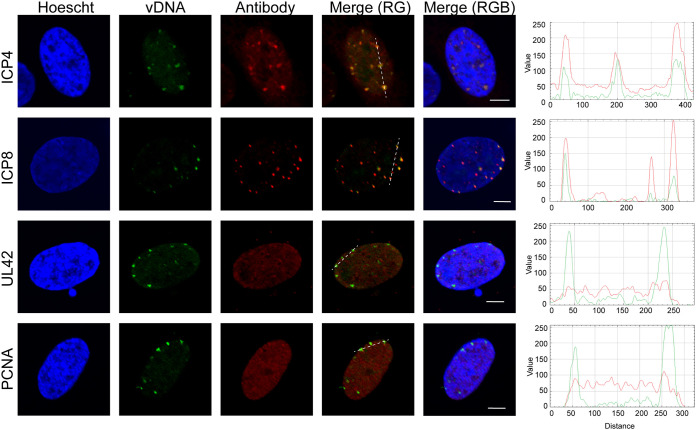
FIG 11.
Protein recruitment to viral DNA after ACV treatment. Cells were infected with EdC-labeled KOS at an MOI of 10 PFU/cell in the presence of 100 μM ACV. After 6 h, infected cells were fixed and EdC-labeled DNA was tagged with an Alexa fluor to visualize viral genomes (vDNA). Viral and cellular proteins were visualized by immunofluorescence. Green and red trace of merge (RG) panel is shown at right. Scale bars, 5 μm.

