
Figure 2:
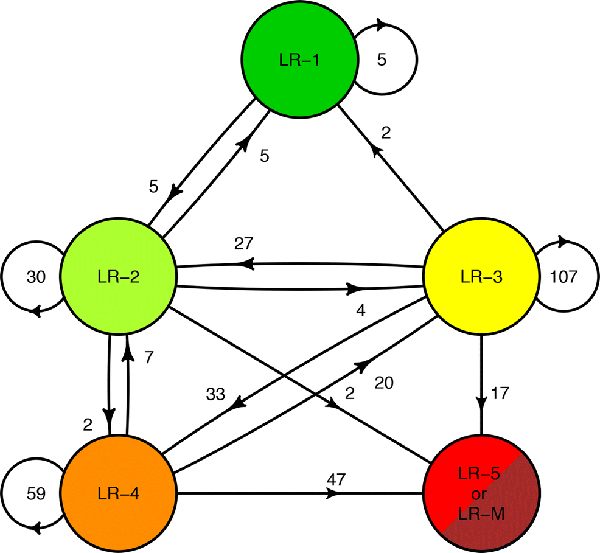
Flow diagram illustrating the counts of each observation transition at the end of follow-up. Although the most of observations remained stable, observations exhibited significantly different rates of progression to higher LI-RADS categories based on their index category.