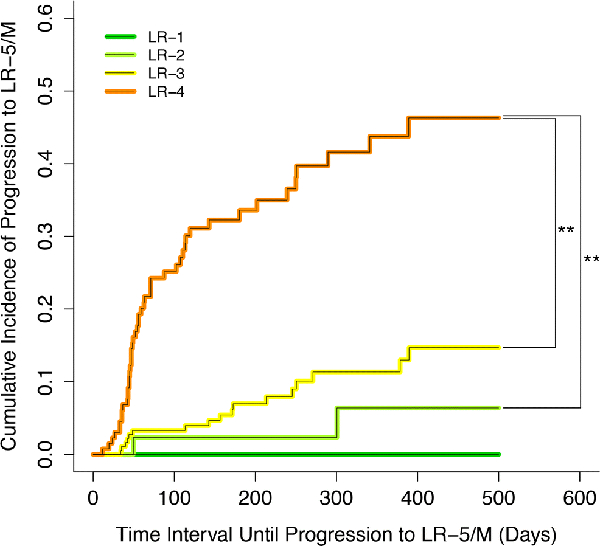
Figure 4:

Cumulative incidence curves for progression to LR-5 or LR-M shown for LR-1 (green), LR-2 (light green), LR-3 (yellow), and LR-4 (orange). Vertical bars indicate statistically significant pairwise comparisons assessed using Bonferroni-corrected log-rank tests with a resampling extension.
