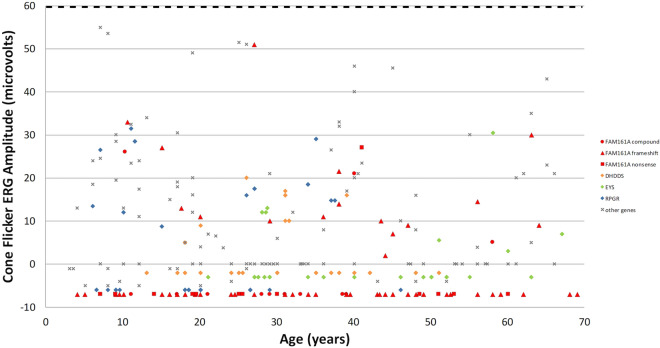
Figure 6.
Cone flicker ERG amplitudes at 1st testing. A total of 231 genetically identified patients were included, and the average cone flicker amplitude between the two eyes as measured at the earliest ERG test performed in each of the patients is presented. Genes with at least 20 patients each (FAM161A [red, with different shapes representing the three genotypes)], DHDDS [orange diamond], EYS [green diamond], RPGR [blue diamond]) are specifically marked, while genes with less than 20 patients per gene share the same annotation (gray x) on the graph (ABCA4- only patients with an RP phenotype, ADAM9, BBS2, C2ORF71, C8ORF37, CDHR1, CERKL, CNGA1, CNGB1, CRB1, IMPG2, MAK, NRL, PDE6A, PDE6B, PLA2G5, PRPF3, RDH12, RHO, RP1, RP2, RPGRIP1, USH1C, and USH2A). Since in many patients cone flicker responses were non-detectable, to allow better visualization these "zero" points were spread over the values of – 10–0 uV. Lower limit of normal for cone flicker ERG amplitudes at our lab is 60 uV, marked by a horizontal dashed line at the top of the figure.

