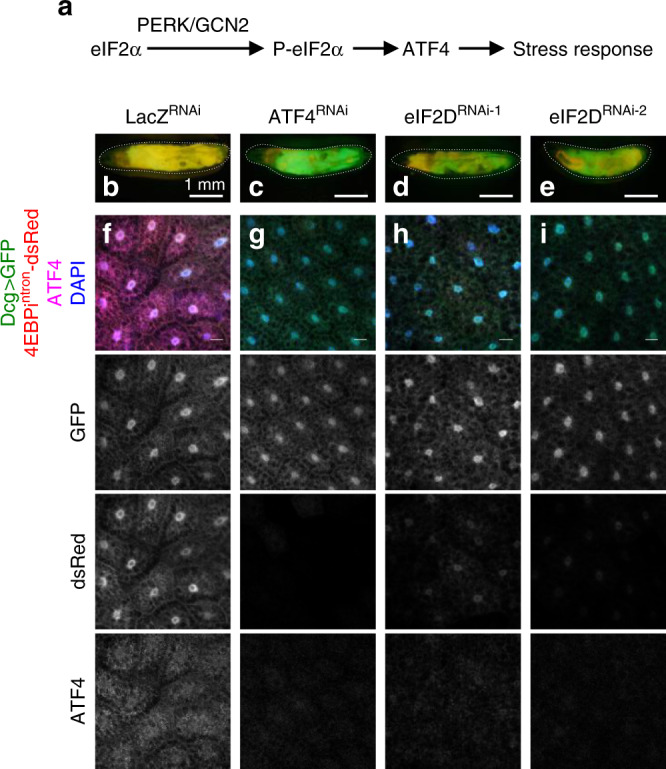
Fig. 1. An RNAi screen to identify genes required for ATF4 translation.

a Line diagram summarizing the ISR pathway in Drosophila. b–e Third instar larvae expressing 4E-BPintron-dsRed reporter with indicated RNAi lines and UAS-GFP driven by the fat body specific Dcg-Gal4. Individual larvae are outlined with dotted lines. Scale bars represent 1 mm. f–i Fat body tissues dissected from larvae in b–e expressing GFP (green), dsRed (red), immunolabeled with antiATF4 antibody (magenta) and DAPI (blue). Scale bars represent 25 μm unless otherwise indicated here and in subsequent figures. Data in b–i are representative images collected from two independent biological experiments with ten animals in each trial.
