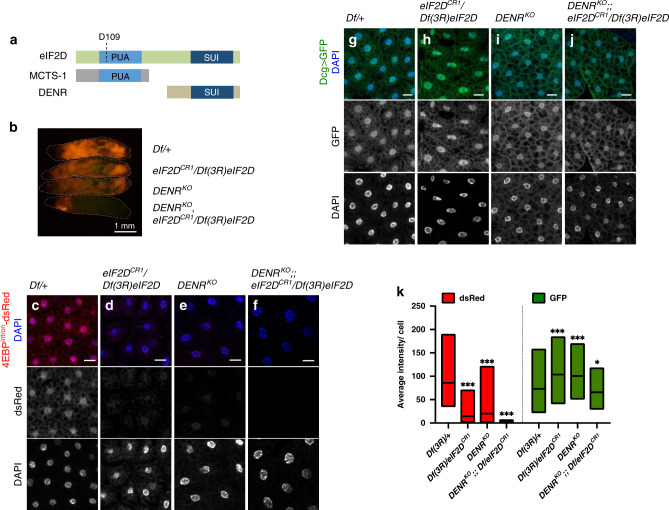
Fig. 3. eIF2D shares its function with DENR.
a A schematic diagram showing the domain architecture of eIF2D, DENR, and MCTS-1. b Expression of 4E-BPintron-dsRed in eIF2D and DENR single mutants (DENRKO) compared with that of DENR; eIF2D double mutants. Individual larvae are indicated with dotted outlines and their genotypes are indicated on the right. c–f Fat body tissues dissected from larvae in b showing 4E-BPintron-dsRed (red) and DAPI (blue). g–j Fat body tissues from larvae of indicated genotypes expressing GFP (green) driven by the fat body specific driver, Dcg-GAL4, and counterstained with DAPI. k Quantitation of fluorescent protein intensity from individual cells in c–j. Midline represents the mean value, with the top and bottom of the box representing the maximum and minimum values. Asterisks above boxes represent statistical significances between mutant and control values calculated with the a two-tailed t-test with ***p < 0.0001 and *p < 0.01. n = 384, 370, 426, 362, 103, 158, 145, and 138, respectively for each box from left to right. Data in b–j are representative images collected from three independent biological experiments with seven animals in each trial. Please see Source Data Files for the raw data used to generate graph in k.

