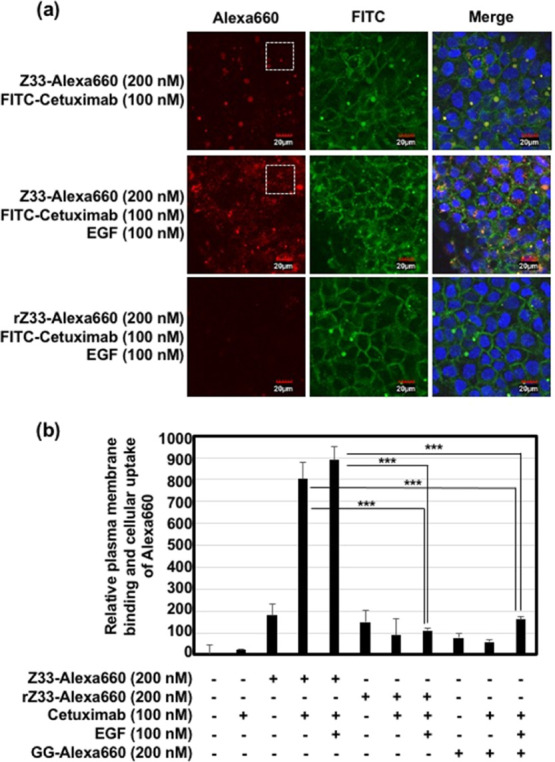
Figure 3.

(a) Confocal laser microscopic images of A431 (human EGFR high expression) cells treated with Alexa660-labeled Z33 or rZ33 (each 200 nM) and FITC-labeled cetuximab (100 nM) with or without EGF (100 nM) in cell culture medium containing 10% FBS for 24 h at 37 °C. Red: Alexa660, green: FITC, blue: Hoechst 33342. Scale bar: 20 μm. Enlarged pictures of (a) (areas within the white dotted square) are shown in Figure S4. (b) Relative plasma membrane binding and cellular uptake of Alexa660 after treatment with Alexa660-labeled Z33, rZ33, or GG (each 200 nM) with or without cetuximab (100 nM) and/or EGF (100 nM) in cell culture medium containing 10% FBS for 24 h at 37 °C prior to cell detachment by EDTA treatment and flow cytometer analysis. The data are expressed as the mean (±SD) of three experiments. ***P < 0.001.
