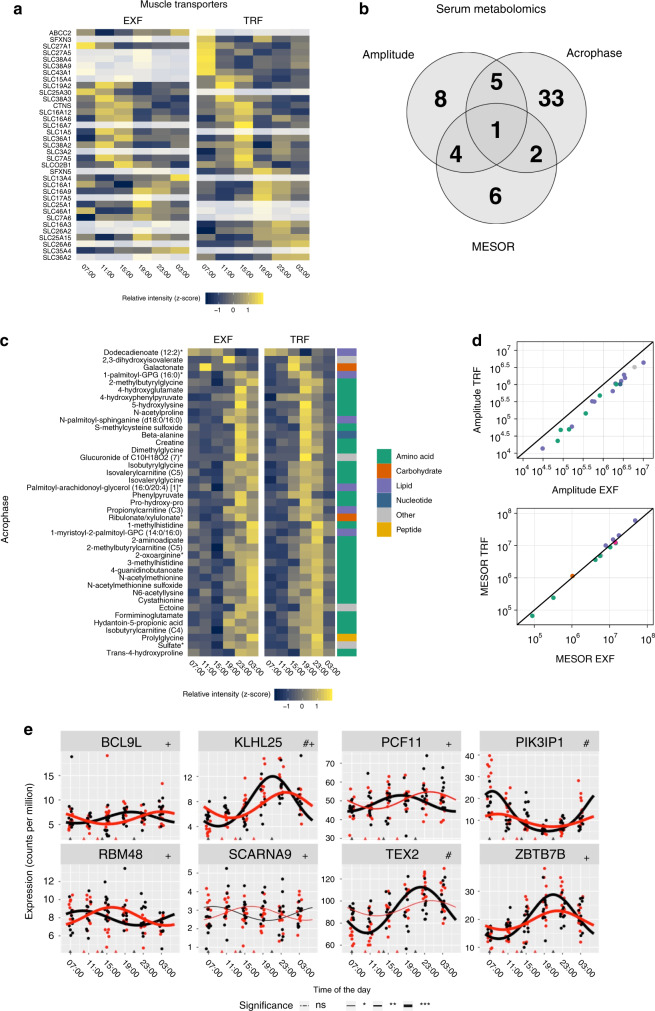
Fig. 7. Transporter periodicity, and differential transcript and serum metabolite rhythmicity.
Heatmap of gene ontology transporter annotated genes enriched in either extended feeding (EXF) or time-restricted feeding (TRF), grayed out cells indicate non-significant rhythmicity, and color z-score normalized expression (a). Serum metabolite significant differences in acrophase, amplitude, or MESOR (b). Heatmap of serum metabolites with differential acrophase between EXF and TRF; cell color indicates z-score normalized expression, and Metabolon super-pathway annotation is indicated in color to the right. (c). Scatterplot of serum metabolites with significant differences in amplitude, with amplitude of EXF on the x-axis, and TRF on the y-axis (top panel), and serum metabolites with differential MESOR, with EXF on the x-axis, and TRF on the y-axis (bottom panel), colors indicate super-pathway annotation (d). Expression of genes with significant differences in FDR adjusted p value in either amplitude (#) or acrophase (+) derived from CircaCompare. Points are individual datapoints, and line represents cosinor regression fit. Black line indicates EXF, and red line indicates TRF. Triangles on the horizontal axis indicate feeding time, line type indicates FDR adjusted RAIN derived p value (e); ns p > 0.05, *p < 0.05, **p < 0.01, ***p < 0.001. n = 11 participants.

