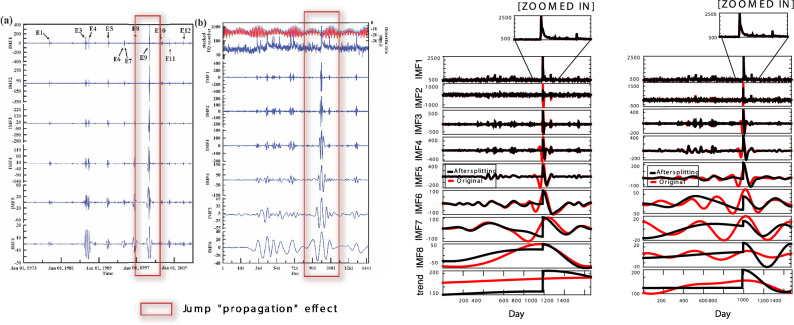
Figure 4.
Spikes and jumps real life example. Adapted from Chen et al.110. Left: From top to bottom, the first six IMFs of the non-stacked data of the number of daily earthquakes from the Taiwanese catalog for events of magnitude from 1978 to 2008. Center Left: The top row shows the temporal variations in theoretical Earth tides at the center of Taiwan with a period of 1462 days (red) and the stacked data of daily earthquake numbers (blue). The second to seventh row display the first six IMFs that were extracted from the stacked time series by Chen et al. In both panels, red boxes highlight the artifacts induced by a jump, in the original time series, which “propagates” through all the IMFs. Center Right and Right: Comparisons of the IMFs produced using EMD and FIF, respectively. The time signal in the first panel is zoomed in to highlight the jump. In red the decompositions obtained using the original stacked data set, and in black the ones obtained after splitting the time series into two disjoint subsets. In particular, we split it at the highest jump, in position 988. We use symmetric extension to produce all the results. Total computational time: 0.3479 s (EMD—splitted signal), 0.0511 s (EMD—original data set), 0.3243 s (FIF—splitted signal), 0.0526 s (FIF—original data set).

