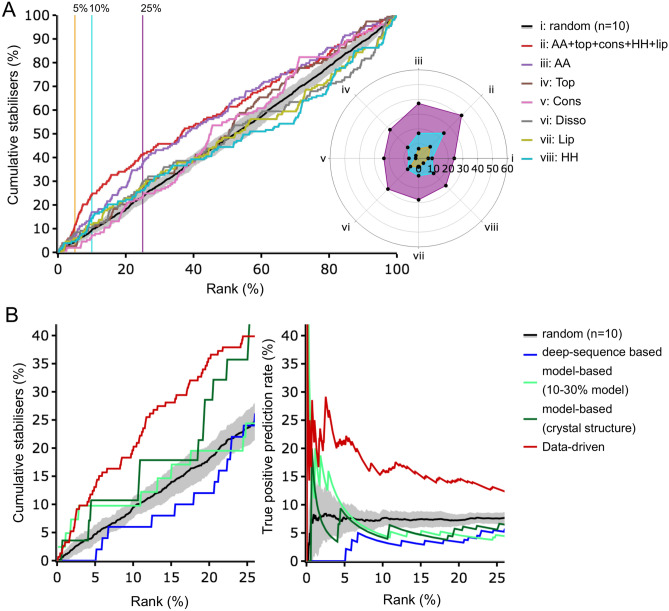
Figure 2.
Performance of IMPROvER for predicting stability. (A) Cumulative scatter plot and radar plot to highlight the effect of different weightings of bioinformatic information in scoring methods to successfully group stabilising hits in the top 5, 10 or 25% of ranked lists (orange, cyan or purple in radar plot, respectively). Methods successful at selecting stabilising residues have lines above random (black) in scatter plot or points further outwards than random (i) in radar plot. Scoring methods tested: i. random, ii. combined score (for amino acid, topology, conservation, predicted helix–helix contact and predicted lipid contact) iii. amino acid score (AA), iv. topology score (Top), v. conservation score (Cons), vi. disorder score (Disso), vii. predicted lipid contact score (Lip) and viii. predicted helix contact score (HH). (B) GPCR stabilising hit data versus rank (position in list after sorting by score) from the three different IMPROvER modules: deep-sequence (blue), model-based using either homology model or crystal structure (light and dark green, respectively) and data-driven (red). Data are displayed with the Y-axis as a cumulative percent of stabilisers found (left) or true positive prediction rate (right). Data shown for random selection were the result of 10 random samplings of the dataset with the mean displayed (standard error is also indicated as grey shading).

