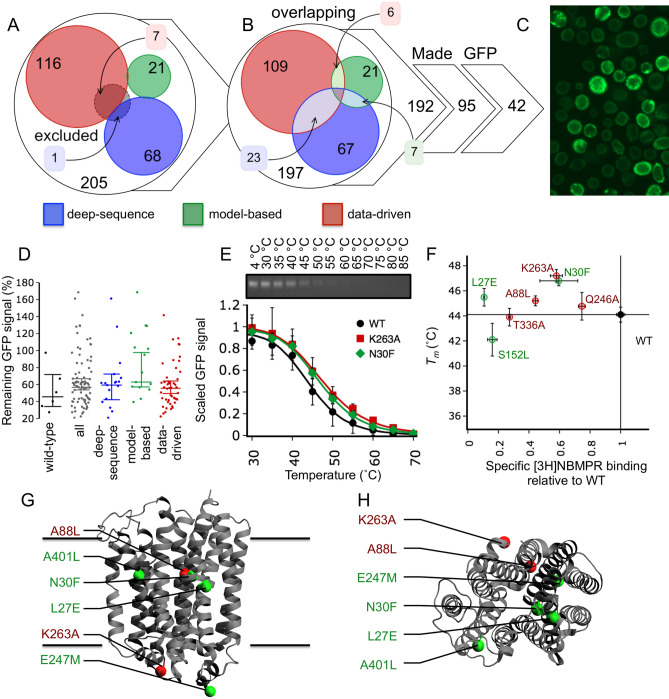
Figure 4.
Using IMPROvER to identify stabilising variants of hENT1. (A) Assessment of residues selected as sites for variation by multiple modules in the IMPROvER pipeline. (B) Comparison of which residues were predicted by IMPROvER modules but excluded due to prior known critical role. (C) Representative example of the GFP-fluorescence observed in Sf9 insect cells expressing GFP-tagged hENT1 variants (cells were expressing variant E264A). (D) Statistical analysis of data collected for hENT1 variant in-gel GFP-based stability assay together, wild-type alone or separated by the module that selected it. Each data point represents a biological repeat of the assessment of protein surviving after being challenged with a temperature of 50 C compared to 4 C sample. In each case the median of all points is displayed with 95% confidence intervals represented as whiskers. (E) Wild-type (WT) hENT1 stability assayed by in-gel GFP analysis (panel insert) after temperature challenges at 30, 45, 40, 45, 50, 55, 60, 65, 70, 75, 80 and 85 C. Wild-type and curves were collected as an average of 12 repeats, whereas variant curves were collected as an average of 2–5 repeats. Double banding pattern on SDS-PAGE attributed to glycosylation of N4828. The sum of intensities for both bands is used as a marker of stability. Data in each curve are normalised to the intensity of sample incubated on ice. Please see Fig. S7A for an uncropped gel image. (F) Scatter plot of hENT1 variant stability versus amount of radiolabelled specific inhibitor [3H]-NBMPR bound in the membrane relative to wild-type. Error bars in panels (E) and (F) are representative of SEM. (G) View in the plane of the membrane and H) perpendicular to the membrane at most stabilising variant hits mapped to the crystal structure of dilazep bound hENT1 (PDB: 6OB7)40. Residues E247 and K263 were absent from hENT1 crystal structures, and so the closest residue visible to the missing one has been used (residues 240 and 281, respectively).

