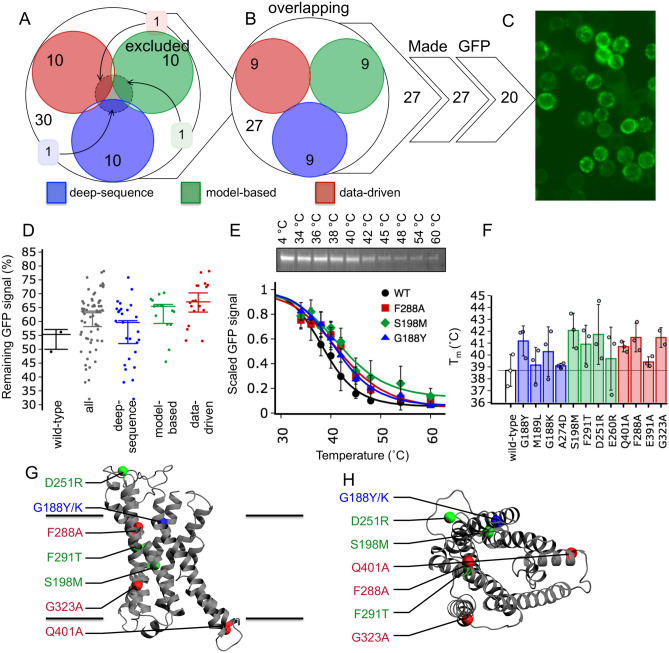
Figure 5.
Using IMPROvER to identify stabilising variants of . (A) Assessment of residues selected as sites for variation by multiple modules in the IMPROvER pipeline. (B) Comparison of which residues were predicted by IMPROvER modules but excluded due to prior known critical role. (C) Representative example of the GFP-fluorescence observed in Sf9 insect cells expressing GFP-tagged variants (cells were expressing variant Q401A). (D) Statistical analysis of data collected for variant in-gel GFP-based stability assay together, wild-type alone or separated by the module that selected it. Each data point represents a biological repeat of the assessment of protein surviving after being challenged with a temperature of 39 C compared to 4 C sample. In each case the median of all points is displayed with 95% confidence intervals represented as whiskers. (E) Wild-type (WT) stability assayed by in-gel GFP analysis (panel insert) after temperature challenges at 4, 34, 36, 38, 40, 42, 45, 54, and 60 C. Wild-type and variant curves were collected as an average of three repeats. Data in each curve are normalised to the intensity of sample incubated on ice. Please see Fig. S11A for an uncropped gel image. (F) Barchart of variant relative to wild-type. Error bars in panels (E) and (F) are representative of SEM. (G) View in the plane of the membrane and (H) perpendicular to the membrane at most stabilising variant hits mapped to the crystal structure of (PDB: 6FJ3)47.

