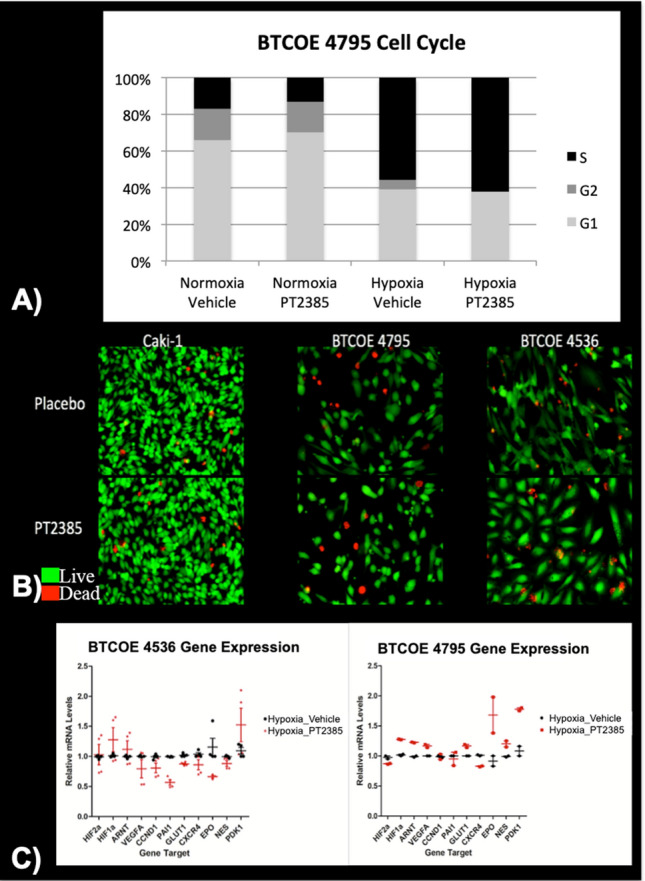
Figure 3.

(A) Cell cycle analysis in glioma cells treated with either 10 μM PT2385 or vehicle in normoxic and hypoxic conditions for 72 h demonstrate no measurable difference between treatment groups. (B) Fluorescent microscopy of cell viability testing in renal cell carcinoma and glioma cells treated with either PT2385 or vehicle in hypoxic conditions with viable cells appearing green and dead cells appearing red demonstrate no visual difference between treatment groups, (C) Real-time PCR gene expression fold changes for hypoxia pathway HIF2α downstream genes were decreased after PT2385 treatment in the BTCOE 4536 cell line and unchanged in the BTCOE 4795 cell line.
