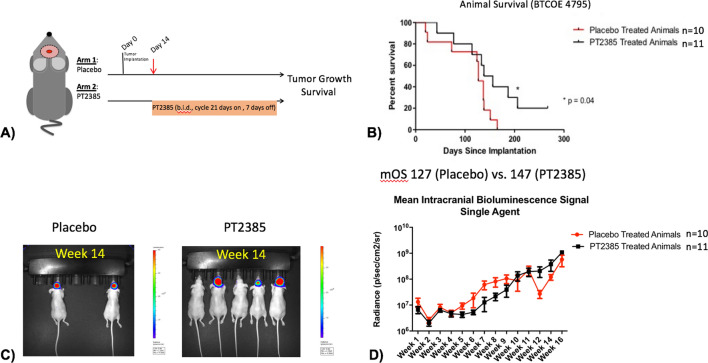
Figure 5.
(A) Experimental design for single agent (10 mg/kg PO BID PT2385 in 21 days on/7 days off cycles) studies (using model BTCOE 4795). (B) Kaplan Meier survival curve demonstrating animals receiving PT2385 survived longer than animals receiving placebo (p = 0.04). (C) Representative bioluminescent images of a cage receiving placebo treatment and a cage receiving PT2385 treatment after 14 weeks with more animals alive and smaller tumor burdens amongst PT2385 treated animals. (D) Graph of bioluminescent values during 16 weeks of consecutive imaging show similar signal intensities when treatment with vehicle is compared to PT2385 treated animals (t = 0.67, p = 0.52).

