
Fig. 1.
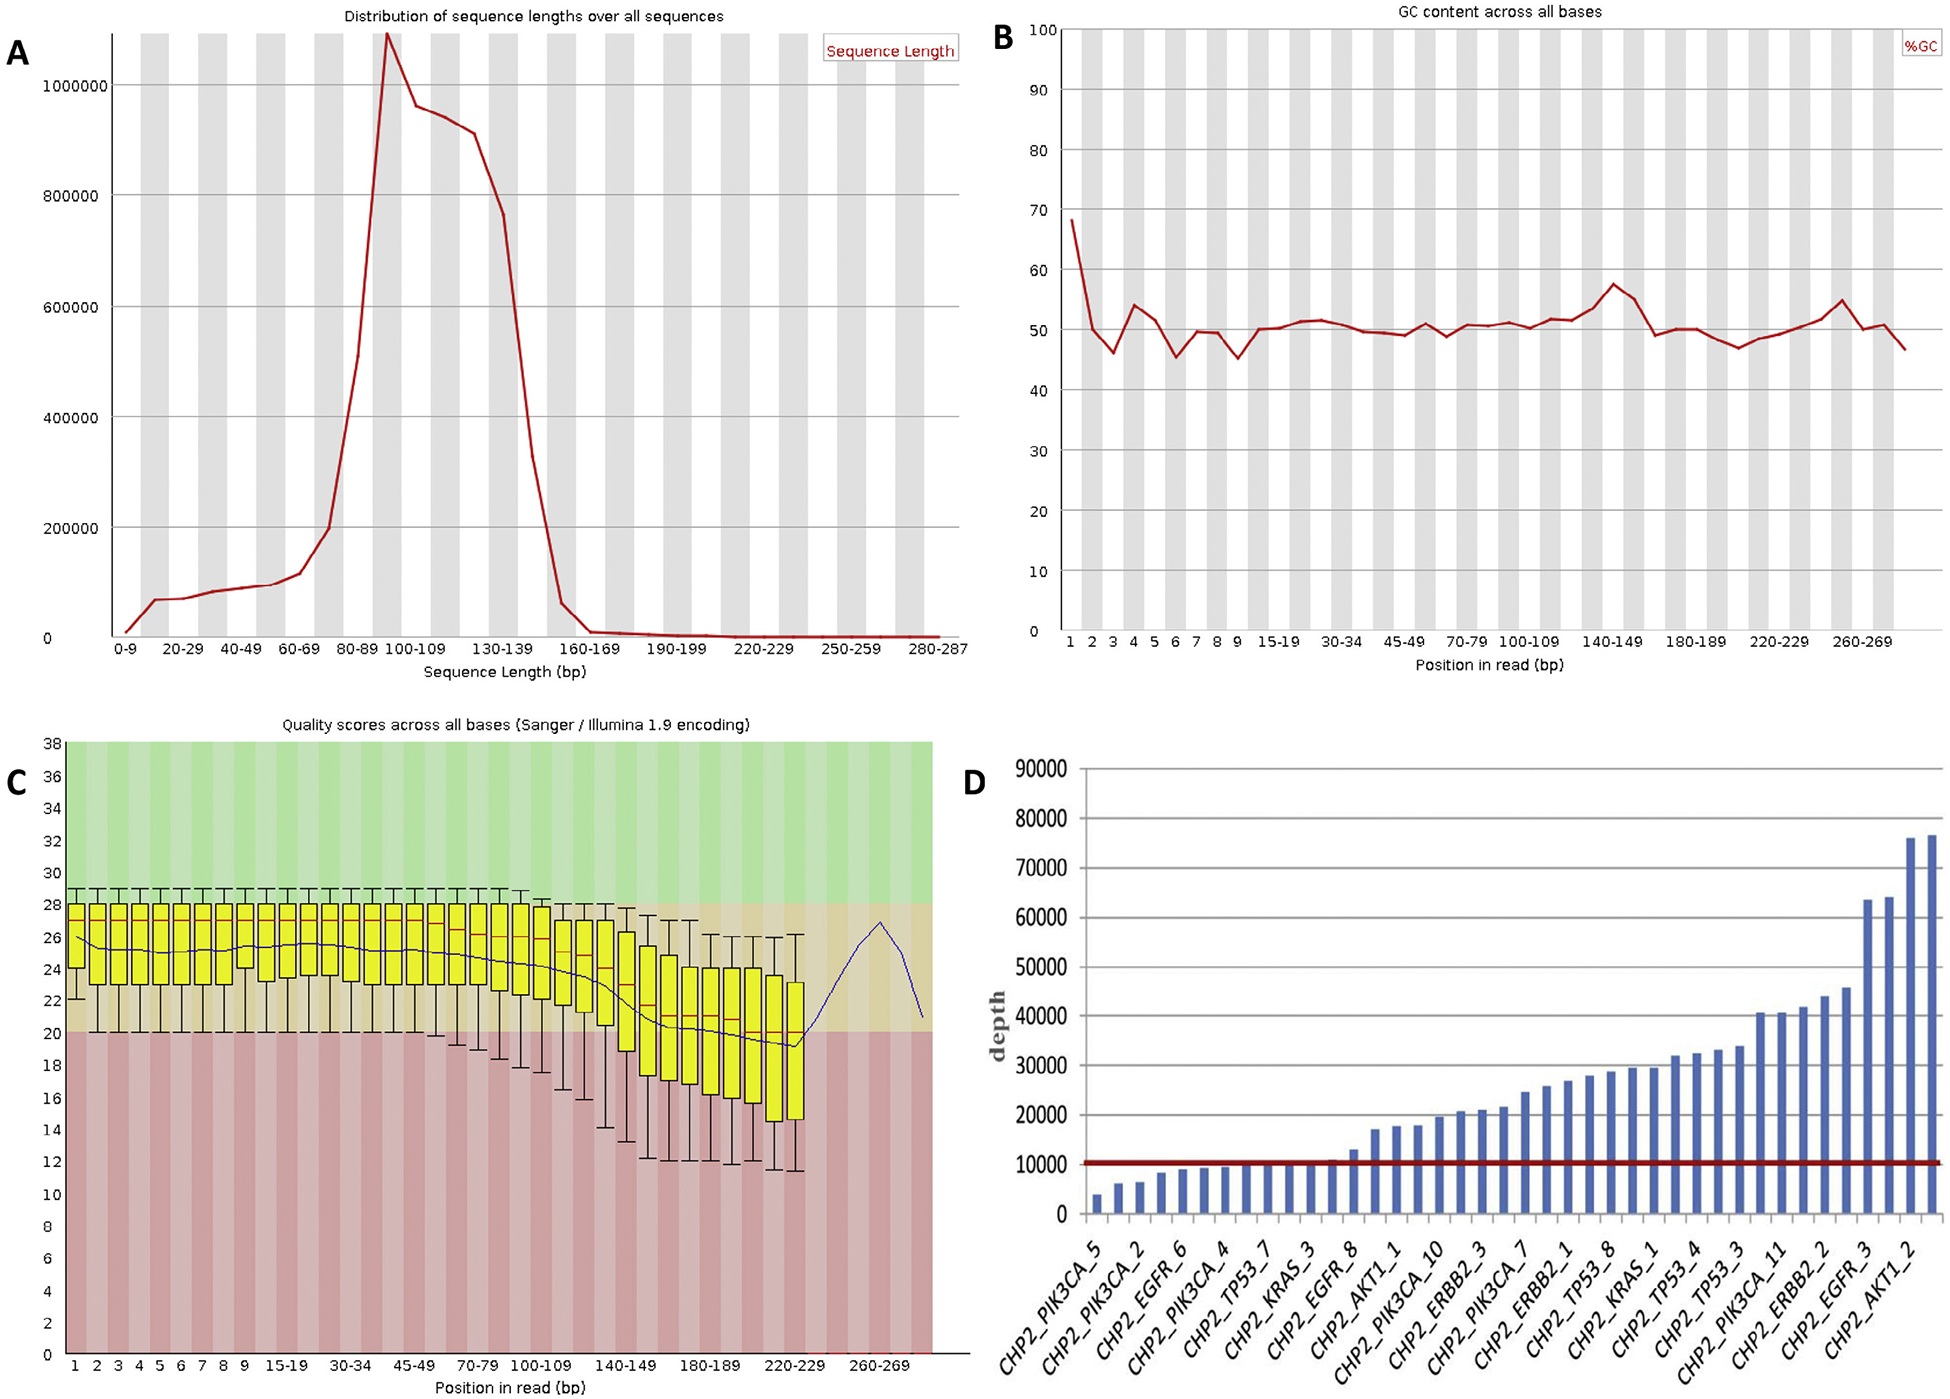
Sequence coverage with the Ion PGM. (A) Distribution of sequence lengths over all sequences of ctDNA-NSCLC-0110 (plasma) is shown. According to the figure, the distribution of sequence lengths was approximately normally distributed, and most of the lengths were in the range between 60 and 160bp. Therefore, the sequences in this range of lengths were selected to carry out further analysis. (B) GC content across all bases of ctDNANSCLC-0110 (plasma). Based on the figure, the GC content in the position from 1 to 20 bp fluctuates widely. Thus, this region of reads was removed during quality control. (C) Quality scores across all bases of ctDNA-NSCLC-0110 (plasma). Every base called from NGS has a quality score which illustrates the accuracy of sequencing. (D) The depth of each amplicon of all plasma samples. According to the figure, the depth of most amplicons is over 10,000×.