
Fig. 4.
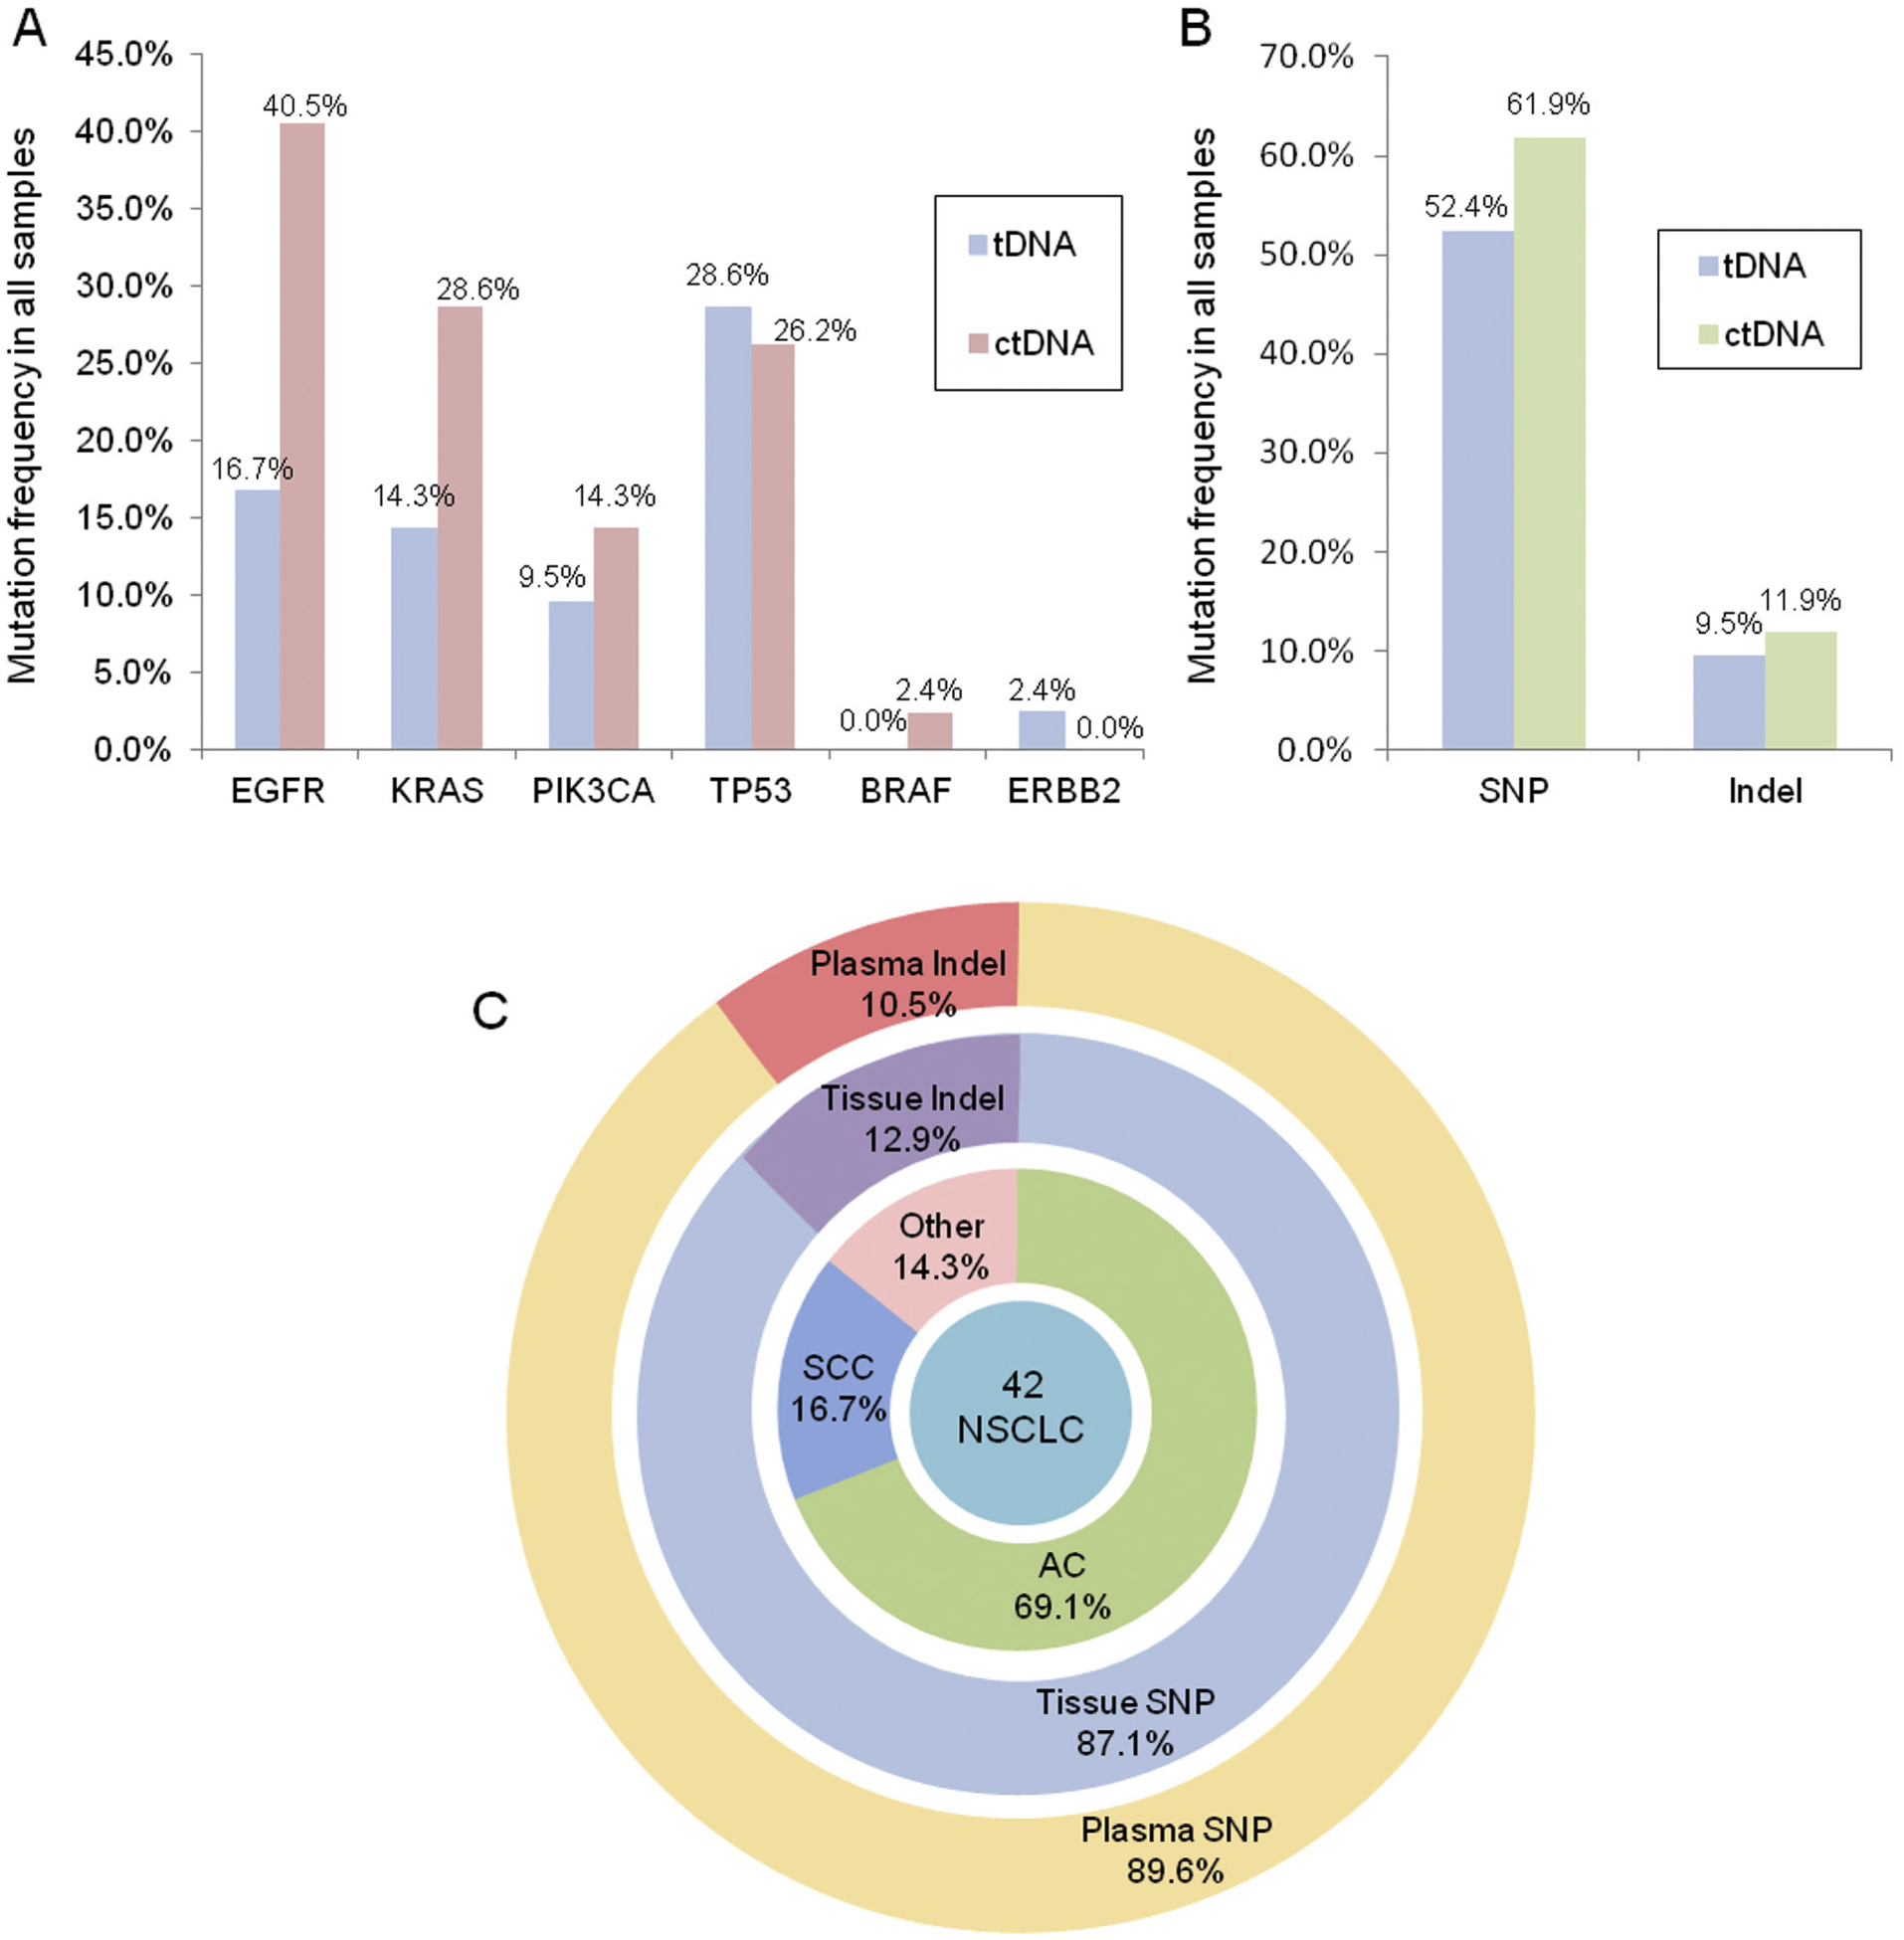
Comparison of the distribution of driver mutations identified in NSCLC tDNA and plasma ctDNA samples. (A) Mutation rates of EGFR, KRAS, PIK3CA, TP53, BRAF, and ERBB2 in the 42 sample pairs; (B) Rates of mutation types (SNPs vs. indels; n = 42 samples). (C) Pie chart showing the distribution of driver mutations identified in matched primary NSCLC tDNA and plasma ctDNA.