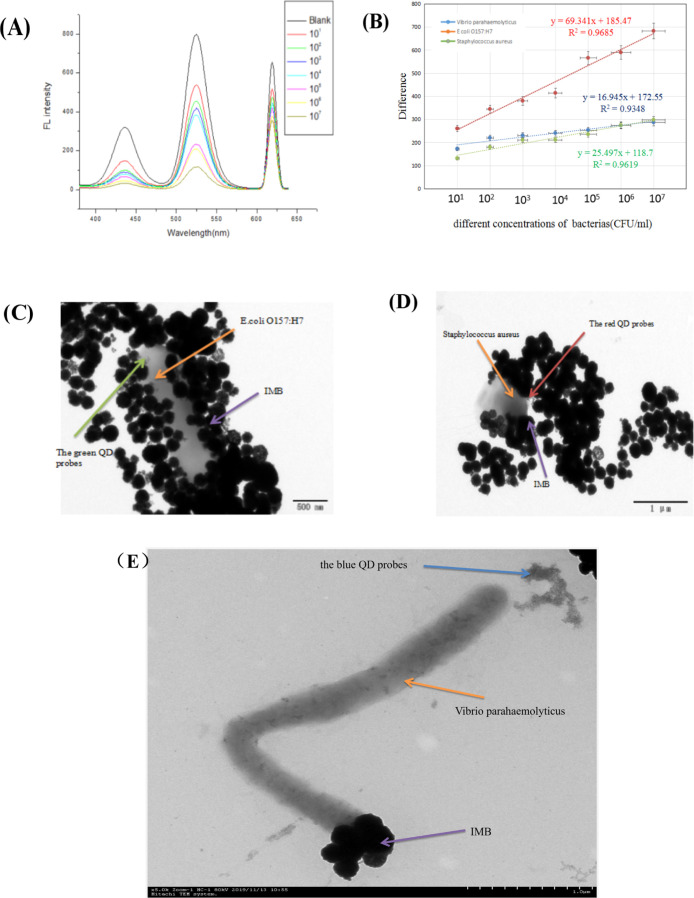
Figure 8.
Sensitivity experiment [(A) fluorescence spectra of different concentrations of bacteria; (B) standard curve of the difference of negative fluorescence to positive fluorescence buffer solution; (C) TEM images of IMB-E. coliO157:H7-the green QD probes; (D) TEM images of IMB-S. aureus-the red QD probes; and (E) TEM images of IMB-V. parahaemolyticus-the blue QD probes].

