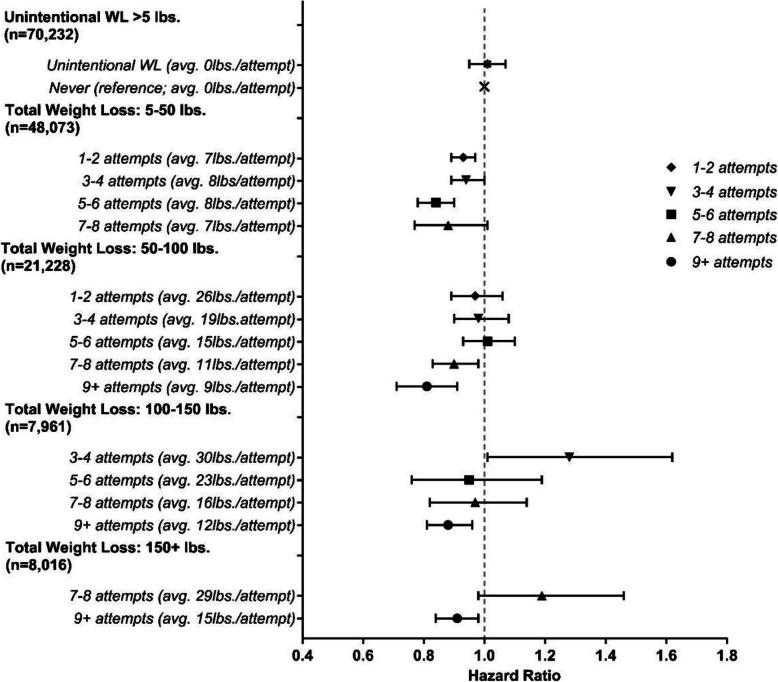
Fig. 3.
Proportional hazard ratios for all-cause mortality based on the joint effects of the frequency of weight loss attempts and the total weight loss based on the sum of those attempts the previous 20 years (n = 161,738). Hazard ratios and 95% confidence intervals (CI) adjusted for age, sex, race/ethnicity, education level, healthy eating index total score, physical activity, sedentary time, smoking, chronic diseases, self-report overall health, marital status, age at retirement, age at menopause, starting BMI, and weight change

