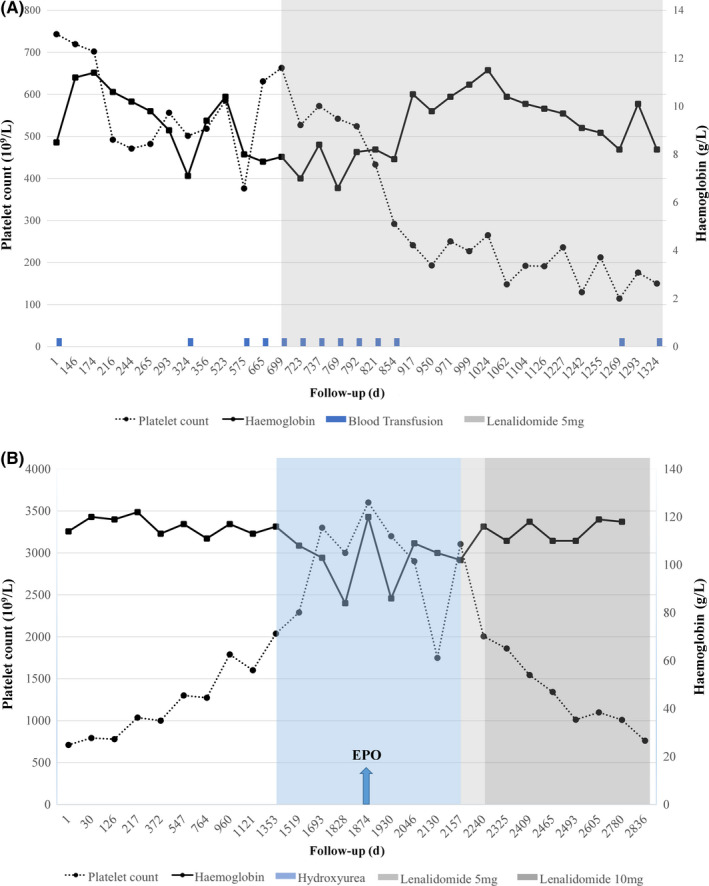
Figure 1.

Course of blood counts for the two patients treated with lenalidomide: A, Patient 1; B, Patient 2. The left y‐axis represents the platelet counts (109/L), and the right y‐axis represents hemoglobin level (g/L). The x‐axis represents the follow‐up (in days)
