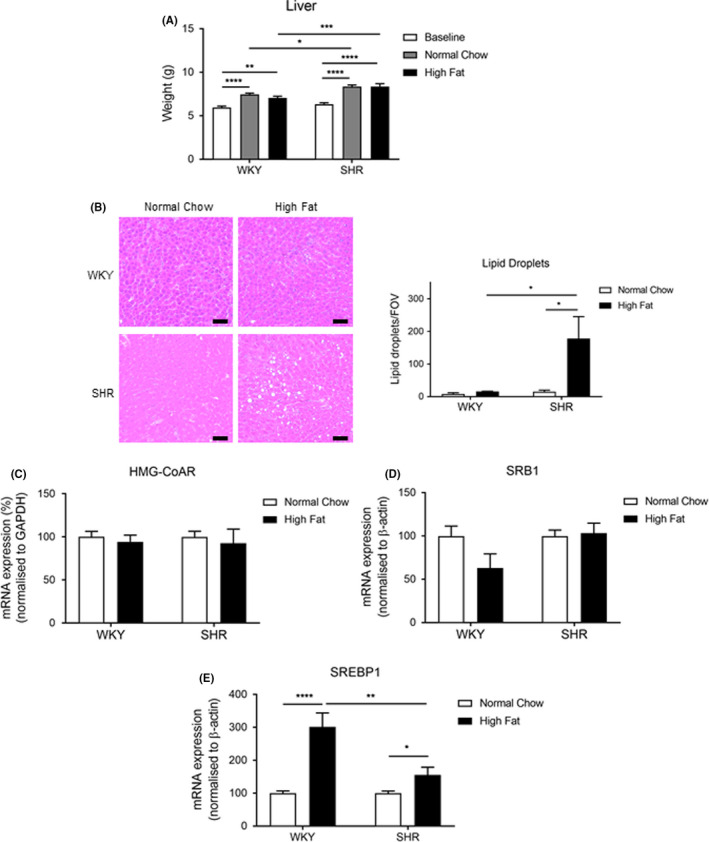
FIGURE 4.

Spontaneous hypertension effects hepatic lipid metabolism. A, Liver weight at baseline and after 8‐wk feeding. B, Accumulation of hepatic lipid droplets after 8‐wk feeding. Left: H&E staining of liver, representative images; scale bar = 50 µm. Right: quantification, n = 5‐6 per group. Hepatic gene expression measured by qPCR after 8‐wk feeding; C, HMG‐CoAR, D, SRB1 and E, SREBP1. mRNA was normalized to GAPDH or β‐actin, n = 5‐6 per group. Results are mean ± SEM two‐way ANOVA; *P < .05, **P < .01, ***P < .001, ****P < .0001
