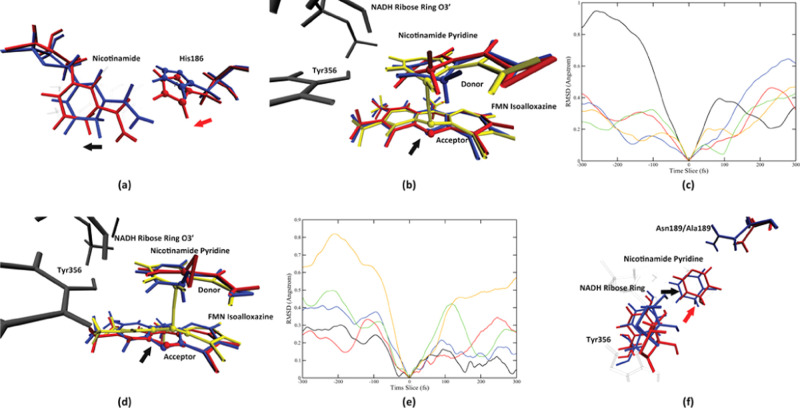
Figure 5.
Conformation change process of the two enzymes. Panel (a) shows the motion from His186 and its effect on the nicotinamide in the wild-type pathway 1, on the start (blue, 300 fs prior to the transition state) and the end (red, the transition state) of the motion, viewing from the top of the nicotinamide ring. The direction of the His186 motion is labeled by the red arrow, and the direction of the effect of the motion is shown by the black arrow. The His186 imidazole ring is labeled by spheres. The direction of the His186 imidazole ring center-of-mass movement is shown as the black dashed line. Panel (b) shows the detailed conformation change of the nicotinamide ring, viewing from the front direction, at 300 fs prior to the transition state (blue), 100 fs prior to the transition state (red), and the transition state (yellow). The NADH ribose ring and Tyr356 are colored gray. The direction of the movement of the acceptor atom is labeled by the black arrow. Panel (c) shows the His186 side-chain center-of-mass root-mean-square deviation (RMSD) using the transition state as a reference, in a 600 fs window centered at each pathway’s transition state. The black, red, blue, green, and orange solid lines represent the wild-type pathway 1, the wild-type pathway 2, the N189A mutant pathway 1, the N189A mutant pathway 2, and the N189A mutant pathway 3, respectively. Panel (d) shows three structures of N189A pathway 3 taken at 400 fs (colored blue) and 200 fs prior to the transition state (colored red and yellow). The NADH classical ribose ring and the Tyr356 residue are colored in dark gray. The donor atom and the acceptor atom are labeled by spheres. The direction of the acceptor atom movement is labeled by the black arrow. The RMSD of the center of mass of the FMN isoalloxazine middle ring is shown in (e), for the wild-type pathway 1 (black), the wild-type pathway 2 (red), the N189A mutant pathway 1 (blue), the N189A mutant pathway 2 (green), and the N189A mutant pathway 3 (yellow), in a 600 fs time window centered at the transition state. Panel (f) shows the overlay of two structures: 100 fs prior to transition state of the wild-type MR pathway 1 (blue) and 200 fs prior to the transition state of the N189A mutant pathway 3 (red). The black and red arrows represent the relative direction between the wall formed by Tyr356 and the NADH ribose ring, and the nicotinamide pyridine, of the wild type and the N189A mutant, respectively.

