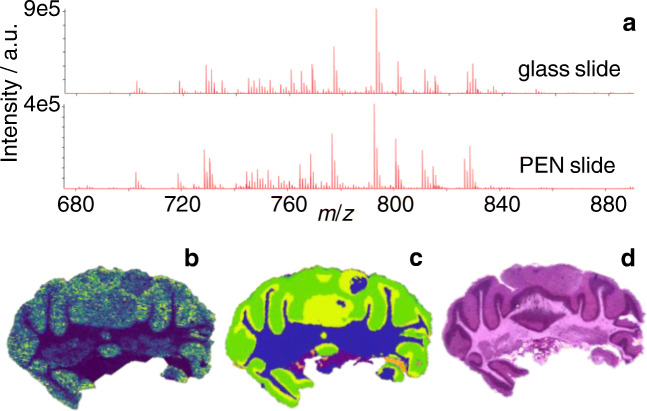
Fig. 2.
MALDI-2-MSI of mouse cerebellum. a Comparison of average spectra acquired from comparable tissue sections of mouse cerebellum mounted on regular glass slide (top) and PEN slide material (bottom) in positive ion mode. b Exemplary MALDI-2-MS image of m/z 792.55 (presumably [PE(40:6) + H]+) recorded in undersampling mode (square pixel size 30 μm; round ablation mark 15 μm in diameter). c Result of segmentation performed with SCiLS lab software. d Optical image of H&E-stained section (located 40 μm behind section used in b)

