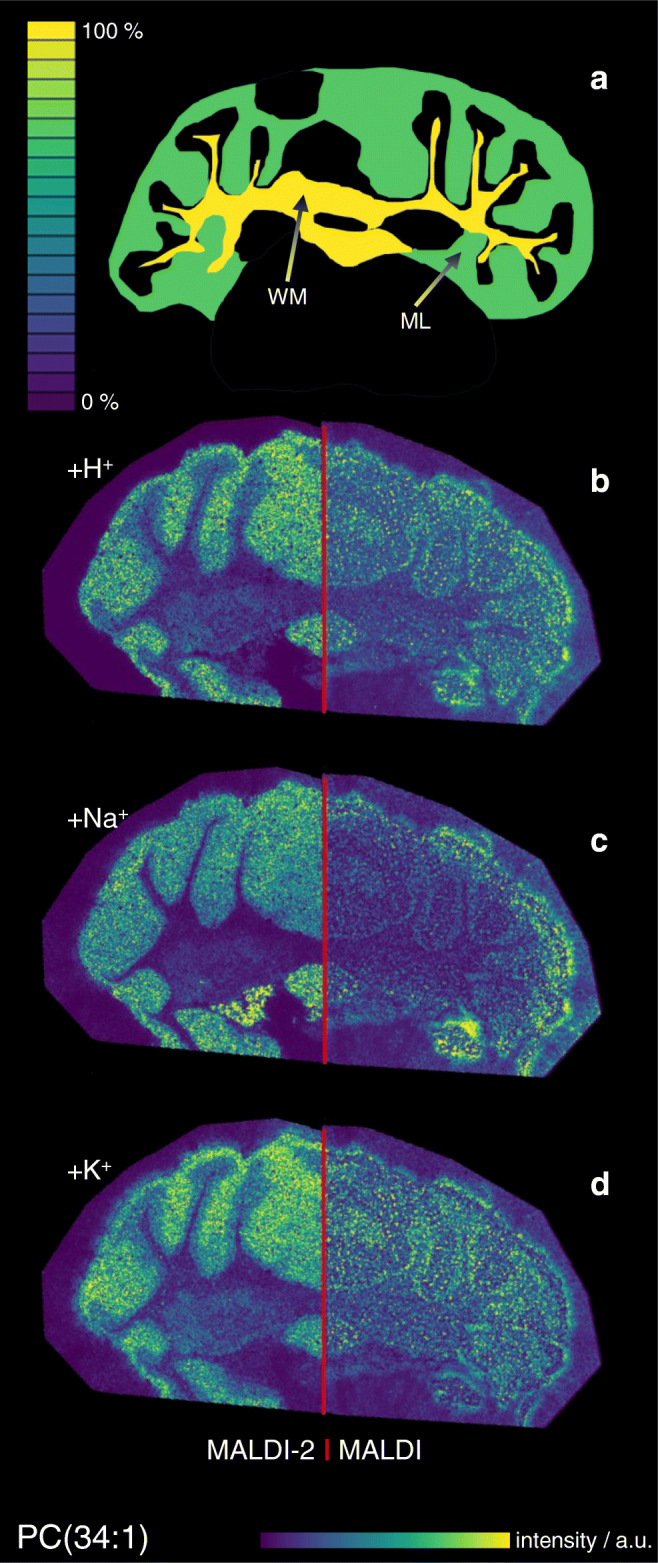
Fig. 3.

Comparison of positive ion mode MALDI and MALDI-2-MSI signal intensity maps with underlying molecular content on the example of PC(34:1). a Schematic depiction of the molar distribution of PC(34:1) in the white matter (WM) and molecular layer (ML) based on quantitative nano-HPLC-ESI-MS analysis after laser microdissection and solid-liquid extraction. b–d Signal intensity distribution of [PC(34:1) + H]+ (b), [PC(34:1) + Na]+ (c), and [PC(34:1) + K]+ (d) measured from glass slide with DHAP as a matrix in positive ion mode at 20 μm pixel size using conventional MALDI (right) and MALDI-2 (left)
