
Fig. 6.
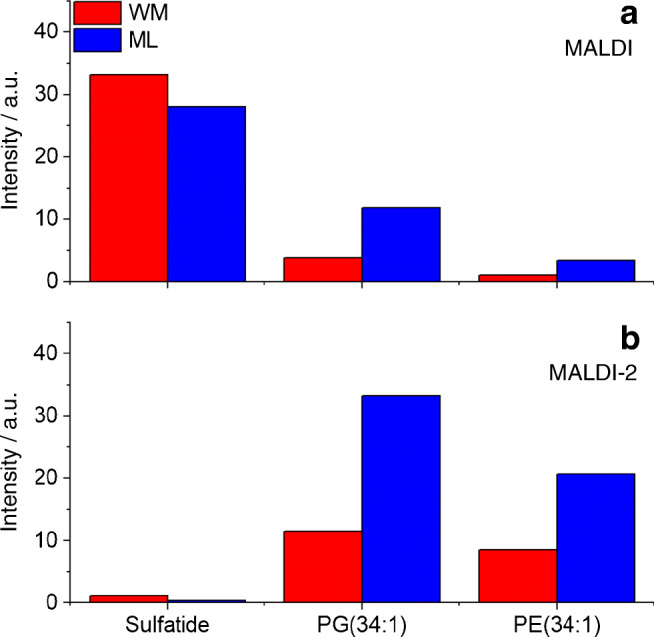
Signal intensity response from tissue in negative ion mode for different lipids. Values represent the average MALDI (a) or MALDI-2-MSI (b) signal intensity derived from the molecular concentration (nmol/mm3 of fresh frozen tissue) present in the tissue region for white matter (WM, red) and molecular layer (ML, blue). Average signal intensities derived from deprotonated ion species. Sulfatide: (3′-sulfo)Galβ1-1Cer(d18:1/24:1)