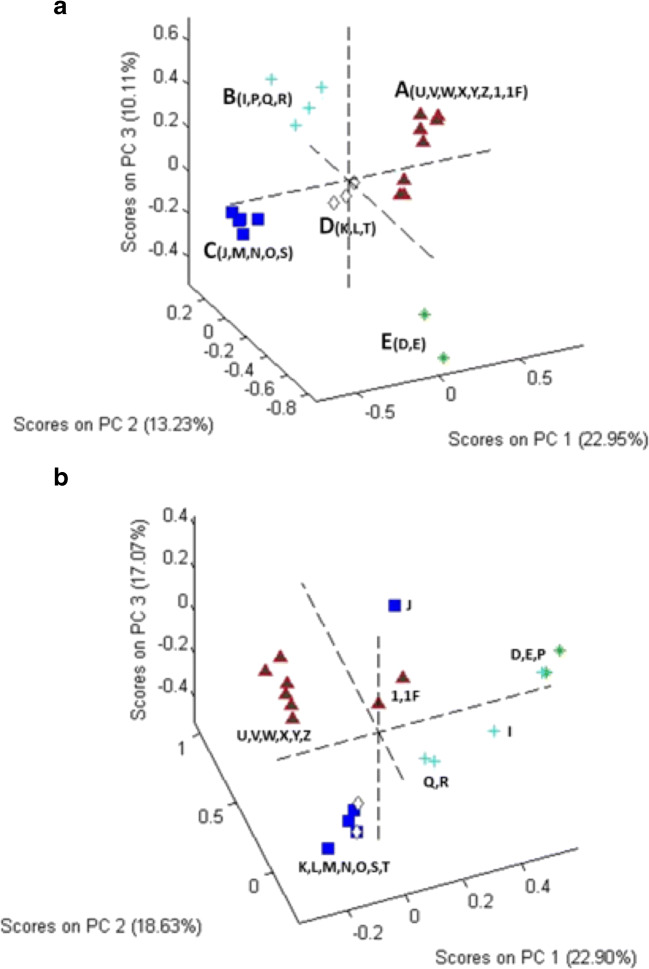
Fig. 4.
PCA score plots for chromatograms of a unhydrolyzed and b hydrolyzed samples. In a, the clusters are color coded: cluster A (samples U, V, W, X, Y, Z, 1, and 1F), cluster B (samples I, P, Q, and R), cluster C (samples J, M, N, O, and S), cluster D (samples K, L, and T), and cluster E (samples D and E). In b, the color codes from a are used to illustrate the change in relative composition of the samples

