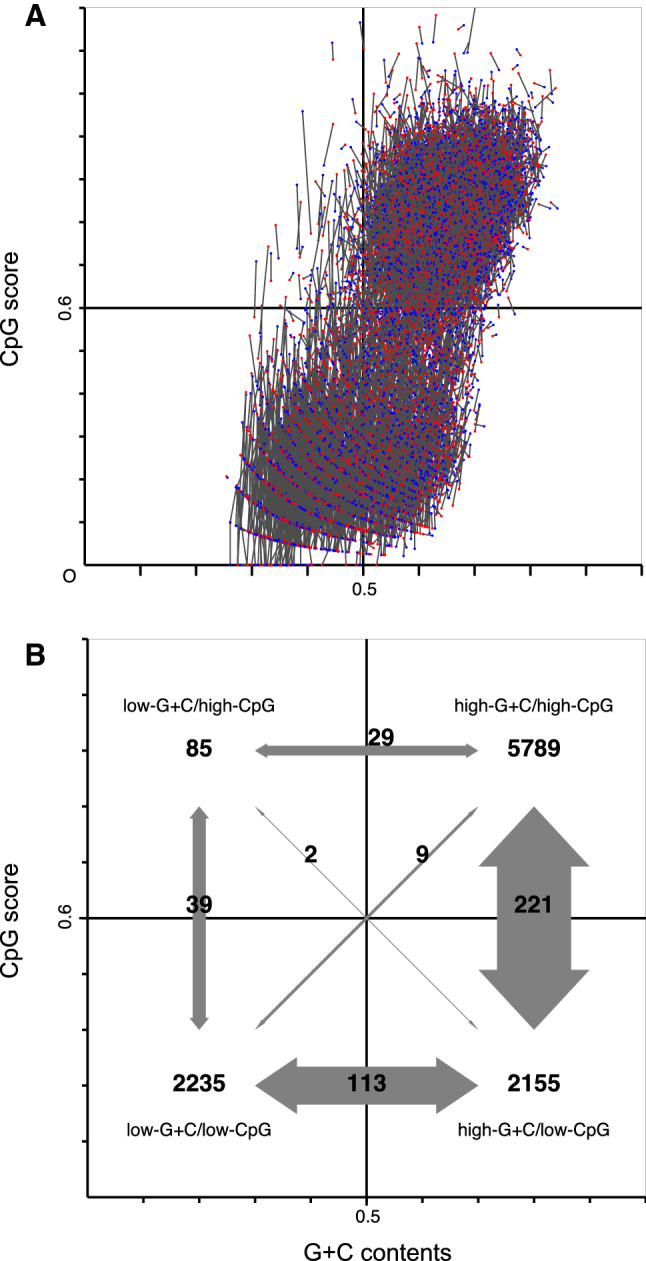
Fig. 4.

Scatter plot of aligned human and macaque promoter pairs. Horizontal and vertical axes represent G + C content and CpG score, respectively. The vertical 0.5 and horizontal 0.6 lines split the promoters into four groups. The top right group corresponds to CpG-island promoters; the other three groups correspond to non-CpG-island ones. a Each line connecting human (blue dot) and macaque (red dot) promoters represents a change in the contents and scores between the two species. Most connecting lines were short, indicating the contents and scores are highly conserved between human and macaque. A scalable version of this scatter plot is also provided (supplementary Fig. S1). b Numbers representing change in promoter types between humans and macaque. The numbers were obtained by counting the connecting lines that span the group border and are shown with gray arrows. Width of the gray arrow represents number of changes between two groups. CpG score changes in high-G + C content were predominant. Intriguingly, almost all invertebrate ascidian promoters clustered in the top left group
