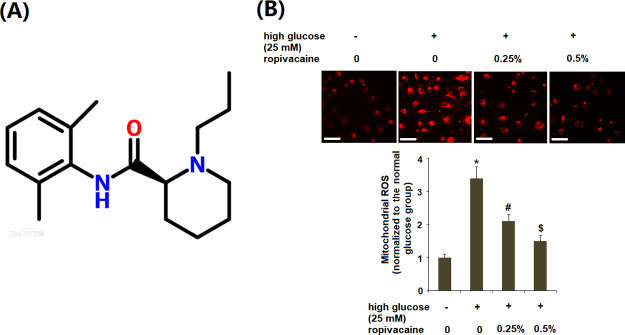
Figure 1.
Ropivacaine ameliorated the production of mitochondrial ROS in HUVECs. (A) Molecular structure of ropivacaine and (B) mitochondrial ROS was measured with MitoSOX. Scale bars, 100 μm [*, P < 0.01 vs normal group; #, P < 0.01 high glucose only; $, P < 0.01 vs high glucose + ropivacaine (0.25%), N = 5–6].

