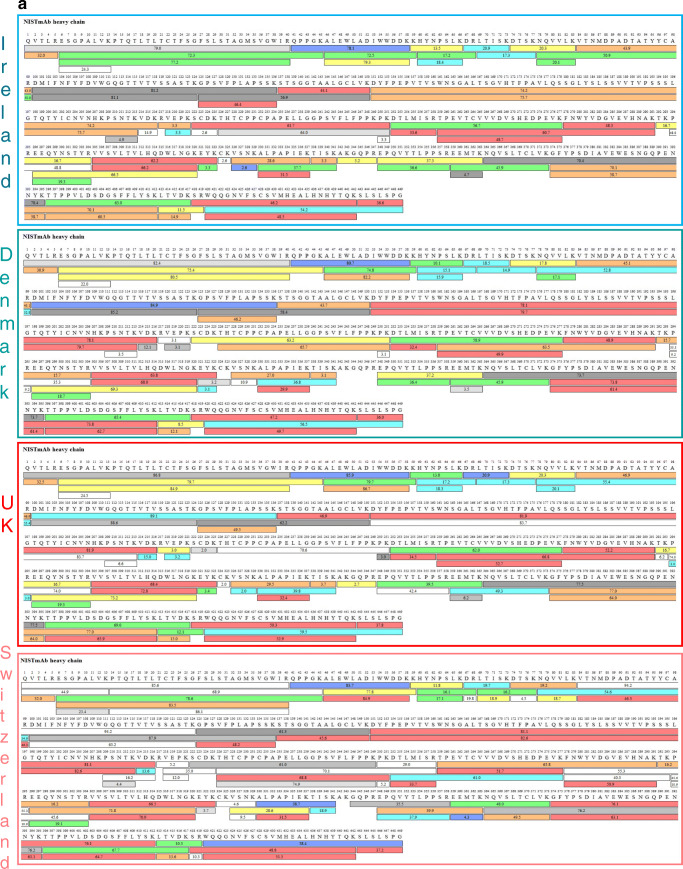
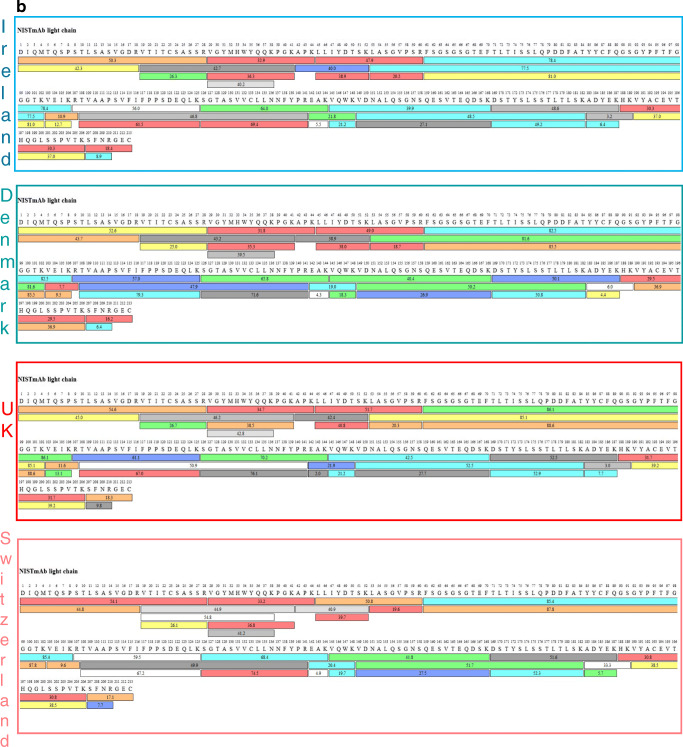
Fig. 6.
a Sequence coverage map of NISTmAb heavy chain obtained from automated trypsin digestions performed in three different laboratories and non-automated digestion performed in Switzerland. The coloured bars show the identified peptides, with the numbers in the bars reflecting the retention time. The different colours indicate the peptide recovery in the MS1 scan: red > 50%, orange > 20% and yellow > 10% represent good recovery. Green, > 5%, light blue > 2% and cyan > 1% represent fair recovery and grey-white scale shows poor recoveries < 1%. b Sequence coverage map of NISTmAb light chain obtained from automated trypsin digestions performed in three different laboratories and non-automated digestion performed in Switzerland. The coloured bars show the identified peptides, with the numbers in the bars reflecting the retention time. The different colours indicate the peptide recovery in the MS1 scan: red > 50%, orange > 20% and yellow > 10% represent good recovery. Green, > 5%, light blue > 2% and cyan > 1% represent fair recovery and grey-white scale shows poor recoveries < 1%


