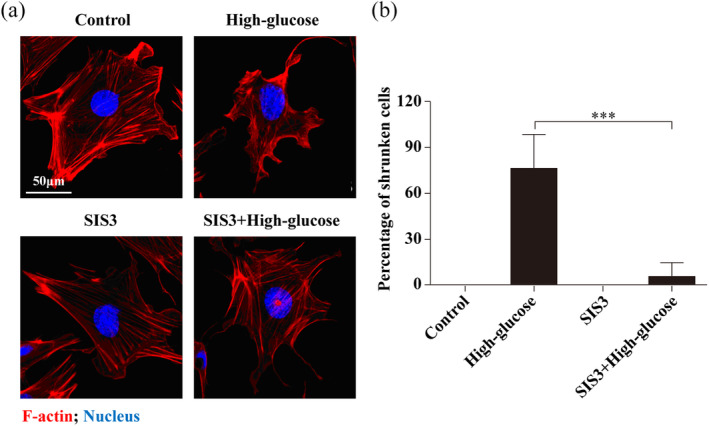
Figure 4.

Distribution of F‐actin upon inhibition of Smad3. A, control or SIS3 group (top left): untreated control podocytes display well‐organized F‐actin; high glucose group (top right): disordered cytoskeleton was observed in podocytes treated with high glucose; SIS3 with high glucose group (bottom left): the Smad3‐specific inhibitor had no effect on F‐actin organization, and (bottom right) appeared to block the disruptive effects of high glucose. Scale bar = 50 μm. B, Percentage ratios of shrunken cells to total cells for each group
