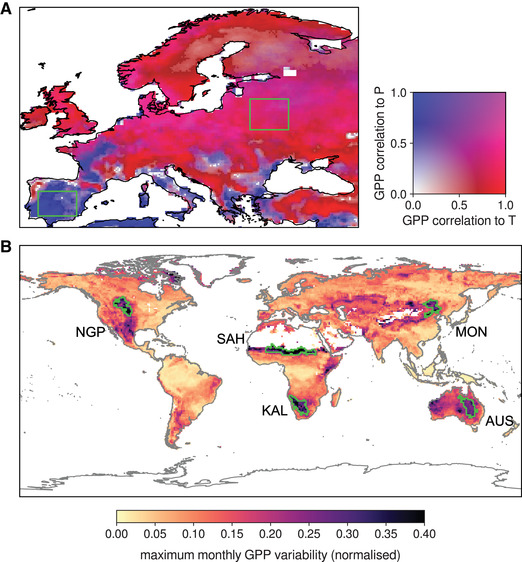
Figure 2.

Delineation of the ecoregions considered as sinks of heat and moisture. (A) Spearman correlation coefficients between growing‐season (FMA) GPP and local temperature (strong relationships indicated by red), and between GPP and precipitation (blue), based on 1980–2013. The two green boxes correspond to the (predominantly) water‐ and energy‐limited ecoregions, respectively, used in the first half of the study. (B) Global hotspots of interannual GPP variability, based on the maximum normalized monthly standard deviation of GPP (1980–2013). The green contours mark the five ecoregions subject to strong interannual GPP variability that are investigated in the second half of the study.
