
Figure 3.
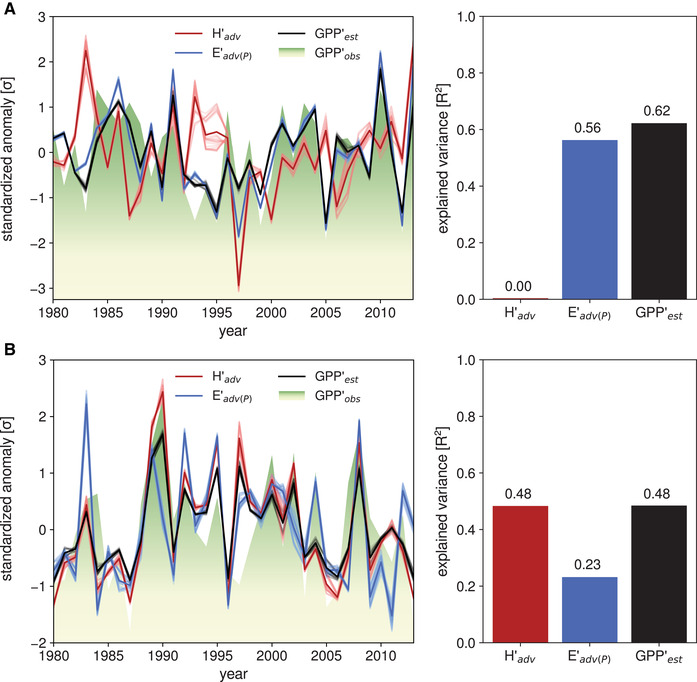
Standardized anomalies in heat (H′adv) and moisture advection (E′adv(P)) and growing‐season GPP (GPP′obs). Individual members and ensemble mean are shown as semitransparent and opaque lines, respectively. The red and blue bars to the right of the time series denote the ensemble mean–explained variances of GPP′obs by H′adv and E′adv(P), respectively, whereas the black bar denotes the estimated GPP anomaly (GPP′est) obtained using the advection estimates of heat and moisture. Results are shown for (A) a predominantly water‐limited ecoregion over the Iberian Peninsula, and (B) a more energy‐limited region centered on Belarus. See Fig. 2A for the precise location of these two regions. Note that the red and blue bars do not add up to the black bar because of covariances between advected quantities (see Methods).