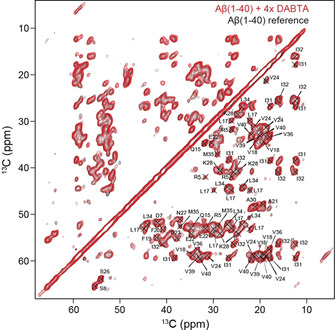
Figure 2.

Superposition of 2D 13C,13C PDSD spectra of 13C,15N‐labeled Aβ(1‐40) fibrils (black) and Aβ(1‐40) fibrils with a fourfold molar excess of DABTA (red), recorded on a Bruker Avance III 750 MHz spectrometer. The MAS rotation frequency was adjusted to 10 kHz MAS. The 13C,13C spin diffusion mixing time was set to 50 ms.
